
Analysis of stocks that are new in the market is not so simple. What is the problem? The analyst must make some assumptions. For the company which has 10-year records, the assumptions-list is much shorter.
Recently I met a friend who enquired me about the recent IPO (in Dec’2020) of Mrs. Bector Food. Someone advised him and, he looked interested in this stock. So he wanted to know my views on it.
I’m not much of an IPO person. I prefer analyzing stocks which at least have 10-years data available for scrutiny. That is the reason why my excel based stock analysis worksheet also uses 10-years of data.
Stocks having less than 10-years of financial data cannot be analyzed using this worksheet. It is one of the limitations of my worksheet. But over the years, I’ve realized that it does not work as a limiter. Instead, it works as a safety net for me.
But this does not mean that we cannot analyze stocks having less than 10-years of data. In this article, we will try to do just that. We will take Mrs. Bector Food as our example company and analyze its stocks.
Introduction
To do the analysis of stocks, we need its financial data. What data is required? We will need its balance sheet, profit and loss accounts, and cash flow statements. My worksheet uses the last 10-years’ data to generate its report.
But in this example, we will consider only two years of data. Though it is not enough to do a proper fundamental analysis of its stocks, this is how we would proceed in this article.
Ideally, we should proceed with the analysis of stocks by first knowing about the company. I call it story building. But in this typical case, we will look only at the financials. Why? Because at times, knowing about the company can make us biased. How?
Imagine my stock analysis worksheet gives a low score to companies like RIL, HUL, Britannia, among others. You’ll find it hard to comprehend the logic behind the score, right? People get skeptical because these are famous brand names with excellent business models.
But it often happens that we cannot buy stocks of great companies because they are trading at overvalued price levels. Moreover, not all famous companies can score well in terms of their profitability and growth metrics. Hence, my worksheet yields a low score for them.
My product is not perfect. I agree. But over the years, with its evolving algorithm, I’m relying more on its analysis. It can at least give a perspective about the company to its users. It can prevent judging stocks blindly.
So this explains why we will do the analysis of Mrs. Bector Food without first knowing about it (read here to know its story).
Analysis of Stocks [Mrs. Bector Food]
Let’s logically begin the analysis. During our check, I would also try to highlight the need for 10-year financial data. We will start with liquidity analysis.
#1. Liquidity Check
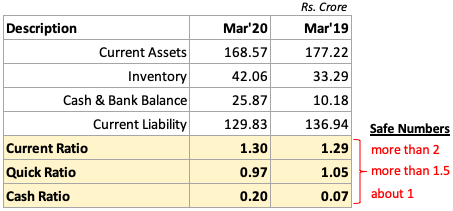
We are doing this check to know if the company has enough liquidity to meet-up its immediate obligations (current liability). What do we mean by current liabilities? They can be vendor payments, the due loan interest, among others.
How to check liquidity? We can use three liquidity ratios (current ratio, quick ratio, and cash ratio). Ideal numbers for these ratios will be two (2) or more (for the current-ratio), 1.5 or more (for the quick ratio), about 1 (for cash ratio).
Mrs. Bector Foods’ numbers are shown above. In terms of liquidity, the company might get into problems, but its chances are low.
In liquidity analysis of stocks, I also like to see a pattern of how these ratios have changed over the last 10 years. We would like to see an upward sloping curve. But for Mrs. Bector Food, we do not have this liberty.
#2. Solvency Check
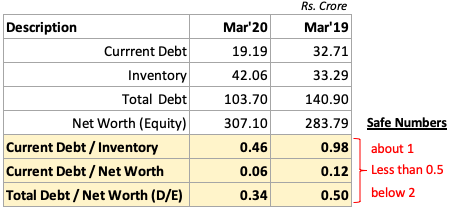
A solvency check is done to quantify if the company is relying too much on debt to meet its capital requirements. Excess debt makes the company risky for its investors.
How to check solvency? We can use three solvency ratios (current debt/inventory, current debt/equity, and total debt-equity). Ideal numbers for these ratios will be about 1, less than 0.5, and about two (2), respectively.
Mrs.Bector Food numbers are shown above. The company looks safe. Its debt usage is low.
Here as well, a trend analysis of the past would be ideal. But for Mrs. Bector Food, we have only 2-Years data.
#3. Operating Performance
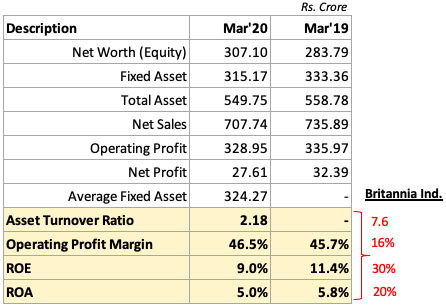
Operating performance ratios are used to judge how well the company is using its assets to yield sales and profits. These are very powerful ratios that say a lot about the underlying business strength of the company.
But there is also a problem with these ratios. In isolation, they are not self-explanatory. Hence to make sense of these ratios we need to compare the numbers with the numbers of a competing company.
Hence for Mrs. Bector Food, I’ve compared its numbers with one sector leader (Britannia Industry). In comparison, Mrs. Bector Food looks like a no-match.
But we must also note that the equity (Capital) raised by Mrs. Bector Food through IPO still needs to be capitalized. I mean, the new Capital is about to generate new-sales and enhanced profit. The benefits are expected only in the coming years.
#4. Financial Risk

The best indicator of the financial risk of a company is its ability to pay back its loans-interest. A reliable metric to measure the risk is called “Interest Coverage Ratio (ICR).” It is the ratio between the company’s PBIT and Interest.
For Mrs. Bector Food stocks, you can see that the ICR for the last two years is 3.26 and 4.86. This number states that the company has generated Four (4) times profit (PBIT) compared to its current interest payable. On the first look, the numbers might look safe.
But let’s look at it from another perspective. The interest expense of the company in Mar’20 was Rs.15.04 Crore. Its PBIT was Rs.49.04 Crore. It means the company must pay 30% of its profit (PBIT) to banks as interest. Now, this number looks high, right?
Now again, compare this number with the ICR for Britannia Industries. This company was generating 30 times PBIT compares to its payable loan-interest.
From this perspective, Mrs. Bector Food does not look so good.
But we must also not forget that Britannia Industries is already a mature company. Mrs. Bector Food is still growing. It is spending high on CAPEX. Probably this is why its ICR is not comparable to Britannia.
#5. Price Valuation Check
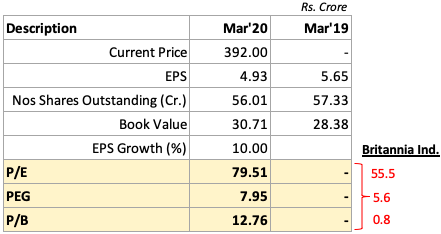
As a rule of thumb, ideal price valuation ratio numbers are as follows: P/E (<15), PEG (<1), and P/B (<1.5). Compare the numbers of Mrs. Bector Food with these ideal numbers. It will look insanely overpriced.
But considering that the company operates in the FMCG segment and that too in the Food industry, price multiples will be higher than ideal. So better will be to compare Mrs. Bector Food with its competitor. A comparison with Britannia Industries is above.
The price of Mrs. Bector Food looks expensive even in comparison to Britannia Industry’s stock. According to my stock analysis worksheet, Britannia itself is overpriced. So it is needless to say that Mrs. Bector Food will certainly not get a high rating from my worksheet.
#6. Intrinsic Value
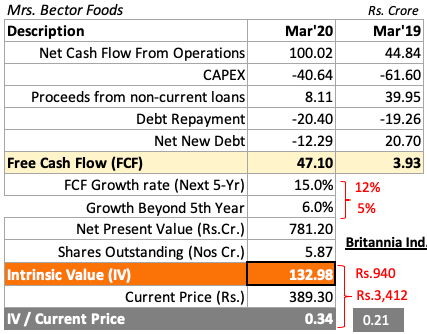
Let’s use the numbers of Mrs. Bector Food and try to estimate its intrinsic value. The calculations are shown above in the image. Its current price is Rs.389 and, the estimated intrinsic value (IV) is Rs.132.98. It means that the stock is currently highly overvalued.
The intrinsic value (IV) of Britannia Industries is Rs.940. Compared to its current price of Rs.3,412, the ratio of IV to the current price is 0.21. Compare this ratio with that of Mrs. Bector Food (0.34). Though both the stocks look overvalued, between the two, Mrs. Bector Food looks better value.
[P. Note: Future FCF growth rate (first 5-Yrs) assumed for Mrs. Bector Food is 15% per annum. For Britannia, it is 12%. Why? Because Mrs. Bector Food being a smaller company, it can grow at a faster rate. FCF growth rate assumed beyond the fifth year is 6% for Mrs. Bector Food and 5% for Britannia].
It is also worth noting that the IPO was offered for subscription at a price band of Rs.286-288 per share. Even at this price, the company’s share price looks overvalued.
About the company – Mrs. Bector Food
Mrs. Bector Food is a company which got listed in NSE/BSE in Dec’2020. It was incorporated in the year 1995. It operates in a consumer food sector. Inherently, this is a sector where volumes are high. The sector leaders are Britannia and Nestle.
Products
Their main product is biscuits (cookies, creams, crackers, digestive, and glucose). The biscuit-based products are sold under the brand name of ‘Mrs. Bector’s Cremica.’
Their other main product is bakery items (bread, buns, kulcha, pizza base, and cakes). The bakery products are sold under a separate brand name of ‘English Oven.’
Manufacturing
The company has six manufacturing facilities spread across India. They have two facilities in Punjab (Phillaur and Rajpura). In Himachal Pradesh, they have one facility. UP (Noida) has one facility. In Maharashtra (Khopoli) and Karnataka (Bengaluru), have one facility each.
Distribution
They are the main suppliers of buns to Burger King, Connaught Plaza Restaurants, Hardcastle Restaurants, and Yum Restaurants.
The manufactured biscuits are distributed across India through 196 nos super-stockists and 748 nos distributors. These stockists and distributors in turn make the biscuits accessible to customers through various retail outlets.
The company also supplies biscuits directly to CSD’s (Canteen Stores Department of GOI), and India Railway Stores, and Canteens.
Bakery products are sold via 191 nos distributors. This distribution network is mainly placed in Delhi NCR, Mumbai, Pune, and Bangalore.
IPO Details
At present, the company is mainly operating in north India as its main market. But in 2023, it is planning to invest Rs.100 (CAPEX) in a greenfield project in Madhya Pradesh. This will help them expand to other states beyond Punjab, Delhi NCR, Maharashtra and karnataka.
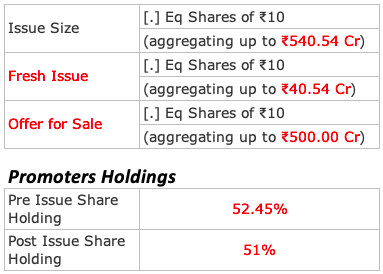
What you see above are the IPO details. There is an interesting observation. Please check the promoter’s holdings before and after the IPO. Before IPO, the holding was 52.45%, and after the issue, it is 51%. Though the issue size is Rs.540 Crore, the reduction in promoters’ holdings is only about 1.45%. Why so?
You can also ask, why promoters were holding only 52.45% shares before the IPO issue? Who was holding the balance shares of the company?
The remaining shares were held by four private equity investors (1) Linus Private Limited, (2) Mabel Private Limited, (3) GW Crown PTE. Ltd and (4) GW Confectionary PTE. Ltd. These investors were selling their shareholdings worth Rs.500 Crore (offer for sale – check above).
Rs.40.54 Crore worth of shares is also offered by the promoters (Fresh Issue). This answers the question that promoters’ holding is reduced only by 1.45% after the IPO issue. Out of the total issue of Rs.540.54 crore, only 40.54 crores are offered by the promoters.
It has also been specified by the company that Rs.40.54 crores worth of shares issued by the promoters will be used to fund the CAPEX plan being executed in their Punjab (Rajpura) facility.
Conclusion
One of the biggest challenges in the analysis of stocks that have less than 10-Year financial data available for scrutiny is, assuming suitable future growth rate numbers.
In the estimation of intrinsic value, we have assumed a number “Future Growth Rate of FCF (Next 5-Yr)”. A reliable way to estimate the future growth rate is by looking at the past FCF growth rates (last 10-year trend). In most cases, FCF growth for the next 5 years will follow the trend of the past.
But in the case of IPO’s, the last 10-Year data is not available. Hence, we will have to either believe in what the company is forecasting about itself, or we have to make a self-assumption. Both are only slightly reliable
Nevertheless, for companies like Mrs. Bector Food, estimating intrinsic value based on self-assumption is not so bad. But for other companies, we must take extra care while estimating the future growth rates.
I hope, this article has given you an idea about how to do an analysis of stocks (like IPO, or relatively new companies). You can also check the FAQ here about Mrs. Bector Food. It will give more clarity about the company.
Have a happy investing.


This is one of the most explanatory articles one can have to understand new shares. Thanks, Mani you are the best.
In price valuation you have written P/E 2 times is that correct…the other one shy be P/B ?
It is P/B. Thanks
Great article, I have one query , is there any source which can let me download the last 10 years revenue data of all listed companies in India in one excel?
Pl check moneycontrol. Thanks
Excellent analysis and much needed guidance for people interested in IPO to rationally analyze and enter rather than punt. It would be nice if a separate link with screeners and upcoming IPO and their pros and cons. Kudos Mani.