There are five ways to invest in gold whose returns are comparable, Gold Mutual Funds, Gold ETFs, Gold Coins/Bars, Digital Gold, and Sovereign Gold Bonds (SGBs). I have not considered gold jewelry because high making charges keep their potential returns too low for comparison. In this article, we’ll know which is the best way to invest in gold.
Our first temptation is to buy physical gold. Contrary to what the mutual fund industry often makes us believe, physical gold can actually be a good investment product. It can yield better returns than Gold Mutual Funds (FOF) and even Gold ETFs.
Yes, it is true. Some might say that the expense ratio of a typical (SBI) Gold Fund (Dir) is only 0.1% and that of a Gold ETF is 0.64%. On the other hand, one has to pay 8% making charges and 3% GST on physical gold (coins).
So, how can physical gold yield higher returns? This is what we’ll answer in this article (check here).
Moreover, there are two gold investment products that can yield higher returns than even physical gold (coins/bars). We’ll know about them as well (read the conclusion)
Let’s start the discussion with gold mutual funds.
Gold Mutual Funds (Fund of Funds-FOF)
| Name of Funds | Gold Price Index | SBI Gold Fund | HDFC Gold Fund | Invesco Gold Fund | Kotak Gold Fund | Axis Gold Fund |
| – | Points | NAV (Dir) | NAV (Dir) | NAV (Dir) | NAV (Dir) | NAV (Dir) |
| 04-Oct-13 | 2,908.78 | 10.18 | 10.50 | 9.92 | 13.86 | 10.83 |
| 03-Oct-23 | 5,759.40 | 17.91 | 18.31 | 17.26 | 23.73 | 18.67 |
| CAGR | 7.07% | 5.81% | 5.72% | 5.69% | 5.52% | 5.60% |
What you can see in the above table is a comparison between the performance of the Domestic Gold Price Index and the five gold mutual funds. I’ve considered only the direct plans of the scheme that give superior returns.
I’ve considered a 10-year period, between Oct-2023 and Oct-2023, for comparison and analysis.
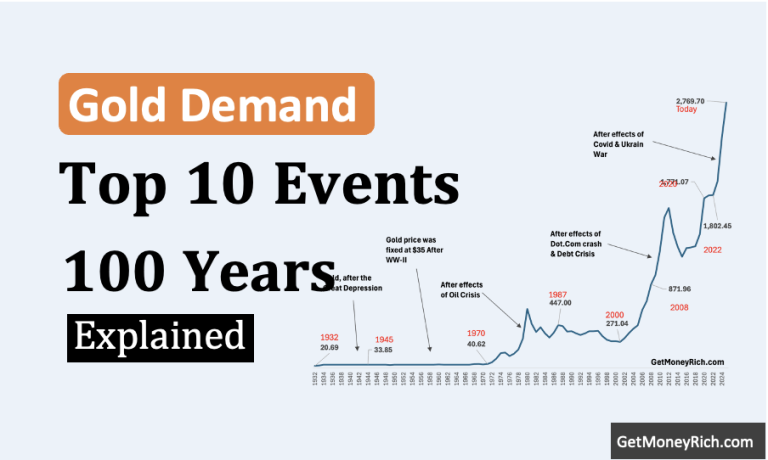
Within this period, the domestic gold price index has grown at the rate of 7.07% per annum. In the same period, the following are the returns on the five mutual funds:
- SBI Gold Fund (Dir): 5.81% p.a.
- HDFC Gold Fund (Dir): 5.72% p.a.
- Invesco Gold Fund (Dir): 5.69% p.a.
- Kotak Gold Fund (Dir): 5.52% p.a.
- Axis Gold Fund (Dir): 5.60% p.a.
On average, compared to a 7.07% per annum return of the index, these funds were able to mimic only 80% of the index’s returns. This means they have underperformed the gold price by about 20%.
So what do you think, 20% underperformance as compared to the benchmark is good or bad? For me, it is not acceptable. I’m sure you will also agree with me.
FAQs of Gold Mutual Funds
It’s because their portfolios have only their own ETFs. For example, the SBI Gold Fund has an SBI Gold ETF in its portfolio. Other schemes keep gold ETFs of their competitor’s ETFs. I’m assuming that this is what enables these five schemes to maintain very low expense ratios (SBI: 0.1%, Kotak: 0.15%, HDFC: 0.18%, Nippon: 0.13%, Axis: 0.17%).
gold mutual funds in India are actually funds of funds. This means that they invest in gold ETFs, which are in turn backed by physical gold.
There are a few benefits in the way gold mutual funds are structured. First, it allows investors to invest in gold without having to open a demat account. Second, it provides investors with access to a wider range of gold ETFs. Gold mutual funds can invest in ETFs from different AMCs. Third, it allows gold mutual funds to offer investors a variety of features, such as dividend payouts and SIPs.
Gold Exchange Traded Funds (ETFs)
| Name of ETFs | Gold Price Index | SBI Gold ETF | HDFC Gold ETF | Invesco Gold ETF | Kotak Gold ETF | Axis Gold ETF |
| – | Points | NAV | NAV | NAV | NAV | NAV |
| 04-Oct-13 | 2,908.78 | 28.22 | 28.76 | 2,842.35 | 28.44 | 28.30 |
| After Brokerage etc | – | 28.42 | 28.96 | 2,862.25 | 28.64 | 28.50 |
| 03-Oct-23 | 5,759.40 | 49.94 | 49.91 | 5,067.95 | 48.68 | 48.76 |
| CAGR | 7.07% | 5.80% | 5.59% | 5.88% | 5.45% | 5.52% |
I’ll again compare the performance of five gold ETFs with the domestic gold price index. The period of comparison is again 10 years (between 04-Oct-13 and 03-Oct-23). Between this period, the domestic gold price index has yielded a return of 7.07% per annum.
Please note that as these are ETFs, they must be bought like shares after paying the brokerage and other transaction charges. I’ve assumed a cumulative charge of 0.7% on account of brokerage, transaction charges, and taxes and duties.
In this 10-year period, the following are the returns on the five ETFs:
- SBI Gold ETF: 5.80% p.a.
- HDFC Gold ETF: 5.59% p.a.
- Invesco Gold ETF: 5.88% p.a.
- Kotak Gold ETF: 5.45% p.a.
- Axis Gold ETF: 5.52% p.a.
On average, compared to a 7.07% per annum return of the index, these funds were able to mimic only 79% of the index’s returns. This means they have underperformed the gold price by about 21%.
This level of underperformance is also not acceptable to me as an investor.
FAQs on Gold ETFs
A typical gold ETF will have about 98% physical gold and 2% Cash and cash Equivalent.
Yes.
Generally, the expense ratio of a gold ETF is typically between 0.5-1.5% per year. Though they also pay a 3% GST like us on physical gold purchases, their expense ratio is still low. Why? This is because gold ETFs are able to negotiate lower prices on physical gold purchases. We have to buy gold at the market rates, but ETFs get better rates.
Here are some of the extra costs that gold ETFs incur: Storage costs: Physical gold in secure vaults. Insurance costs: Physical gold is insured against theft and loss. Transportation costs: They also incur costs transporting their physical gold between vaults. These costs are typically passed on to investors in the form of a management fee.
Domestic: These suppliers typically mine and refine gold in India. Some of the largest domestic gold suppliers include MMTC-PAMP, Hindustan Gold, and Goldmine.
International: These suppliers typically mine and refine gold in other countries, such as South Africa, Australia, and the United States. Some of the largest international gold suppliers include Gold Fields, Newmont Goldcorp, and Barrick Gold.
Physical Gold
| Physical Gold | Gold Price Index | Physical Gold |
| – | Points | Price |
| 04-Oct-13 | 2,908.78 | 3,235.73 ( After Making Charges and GST) |
| 03-Oct-23 | 5,759.40 | 5,759.40 |
| CAGR | 7.07% | 5.94% |
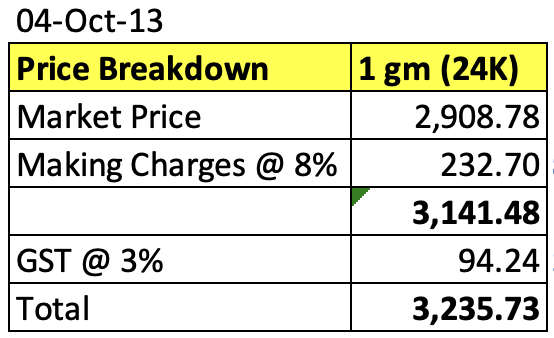
In physical gold investing, an individual investor must pay about 8% making charges and 3% GST on the purchase. Hence, if the market price of a 1-gram gold coin was Rs.2,908.78 (as of 04-Oct-13), the following will be the approximate cost to the buyer:
Actual cost = 2,908.78 * (1+8%) * (1+3%) = 3,235.73
Suppose this investor has held on to this gold coin from 04-Oct-13 to 03-Oct-23 (10 years). In this period the actual price of physical gold has appreciated from Rs.2,908.78 to Rs.5,759.5. This is a price appreciation at the rate of 7.07% per annum.
In the same period, the returns from the physical gold will be 5.95% per annum (see the above table for the calculation)
Compare this with the return generated by the Gold Mutual Funds and Gold ETFs:
| Name of Funds | Gold Price Index | Gold Funds | Gold ETFs | Gold Coin |
| Returns (p.a.) | 7.07% | 5.67% | 5.65% | 5.94% |
So you can, even after the much-hyped and negatively publicized factor of 8% making charges and 3% GST, physical gold is delivering better returns than ETFs and mutual funds.
However, it is also true that, compared to a 7.07% per annum return of the index, the one-gram gold coin could mimic only 84% of the index’s returns. This means that physical gold has also underperformed the gold price by about 16%.
This level of undervaluation is also not acceptable. Considering that a ten-year holding time is yielding a return of only 5.94%, we’ve no alternative but to look for other investment avenues in gold.
FAQ related to physical gold
Please note that the 8% making charges and 3% GST are all one-time charges. Whereas, the expense ratio is a recurring expense charged to us till we hold the fund. Know more about how the expense ratio is charged by mutual funds.
Digital Gold
| Digital Gold | Gold Price Index | Digital Gold | Remarks |
| – | Points | Price | – |
| 04-Oct-13 | 2,908.78 | 2,996.04 | GST 3% |
| 03-Oct-23 | 5,759.40 | 5,586.62 | Spread 3% |
| CAGR | 7.07% | 6.43% | – |
Digital gold investing is offered by several Indian banks (HDFC, ICICI, Axis, etc.) and mobile payment service providers (Google Pay, PhonePe, Paytm, etc.). Though these entities only work as a payment gateway, the actual service providers are MMTC-PAMP, SafeGold, and Augmount.
Following the are charges applicable on the transactions of digital gold:
- GST (While Buying): On the quoted price price of gold, 3% GST is applicable.
- Spread (While Selling): There is a 3% difference in the price quoted for digital gold for buy and sell. This difference is because of two reasons. First, because of the price spread that exists in the bullion market. There, at any moment in time, the sell rates are always less than the buy rates. The second reason is the costs associated with the digital gold management. These costs are related to insurance, payment gateways, custodian fees, etc.
What does it mean? At a moment in time, if the gold rate is Rs.100, the investor will have to buy digital gold by paying Rs.103. Similarly, if one wants to sell digital gold, the price available to him will be Rs.97.
So, after taking a one-time hit of 3% during buying and another 3% hit during selling, what is the performance of digital gold as compared to the domestic gold price index?
Suppose an investor held on to digital gold from 04-Oct-13 to 03-Oct-23 (10 years). In this period the actual price of physical gold has appreciated from Rs.2,908.78 to Rs.5,759.5. This is a price appreciation at the rate of 7.07% per annum.
In this period the price of digital gold appreciated by 6.43% per annum (see the calculation shown in the above table).
Compare this with the return generated by the Gold Mutual Funds, Gold ETFs, and Gold Coin:
| Name of Funds | Gold Price Index | Gold Funds | Gold ETFs | Gold Coin | Digital Gold |
| Returns (p.a.) | 7.07% | 5.67% | 5.65% | 5.94% | 6.43% |
The return generated by digital gold is better than all other options.
However, it is true that, compared to a 7.07% per annum return of the index, digital gold could mimic 91% of the index’s returns. From what we’ve seen till now, we can say that for a return-focused investor, digital gold is the second-best way to invest in gold. Why second best? Because we are about to see an outperformer in the form of a Sovereign Gold Bond (SGB).
FAQ related to Digital gold
Yes.
They say that it is kept safe in the custody of a Custodian. Moreover, the physical vault is also covered under a comprehensive insurance policy. The insurance also covers the gold for the period when gold is in transit.
It is not as safe as other gold-linked investment options. But we must also note that one of the digital gold service providers is MMTC-PAMP. It is a JV between Switzerland-based bullion brand, PAMP SA, and MMTC Ltd, a Government of India Undertaking.
Sovereign Gold Bond (SGB)
| SGB | Gold Price Index | Sovereign Gold Bond | – |
| – | Points | Price | – |
| 04-Oct-13 | 2,908.78 | 2,908.78 | The bonds are held in the books of the RBI eliminating risk of loss of scrip etc. |
| 03-Oct-23 | 5,759.40 | 5,701.81 | The bonds are held in the books of the RBI eliminating the risk of loss of scrip etc. |
| CAGR | 7.07% | 6.96% | – |
Sovereign gold bonds can be purchased online using the mobile app or the online banking apps of banks like SBI, HDFC, ICICI, Axis, etc. The bond is issued by the Government of India (GOI) in tranches. Hence it cannot be purchased as easily as one can buy mutual funds, ETFs, digital gold, or even gold coins.
A prospective buyer of the SGB must keep track of the schedule of tranches. Once the trench becomes available for subscription, one must apply for it online.
For example, in FY 2022-23, the following four tranches were made available for subscription:
| Tranche | Subscription Period | Price offered |
| 2022-23 Series I | June 20-24, 2022 | Rs 5,041 per gram |
| 2022-23 Series II | August 22-26, 2022 | Rs 5,091 per gram |
| 2022-23 Series III | December 19-27, 2022 | Rs 5,409 per gram |
| 2022-23 Series IV | March 6-10 2023 | Rs 5,611 per gram |
In FY 2023-24, two tranches have already been issued:
| Tranche | Subscription Period | Price offered |
| 2023-24 Series I | June 19 – June 23, 2023 | Rs 5,926 per gram |
| 2023-24 Series II | September 11-September 15, 2023 | TBD |
It must also be kept in mind that the sovereign gold bond (SGB) comes with a lockin period of eight (8) years.
But even after these two main limitations, sovereign gold bond is the best way to invest in gold. Compared to a 7.07% per annum return of the index (in the last 10 years), SGB could mimic 98.5% of the index’s returns (see the return calculation).
Moreover, we must also remember that the funds parked in the Sovereign Gold Bond (SGB) also yield an interest of 2.5% per annum. If we add this value, the effective per annum return of SGB will touch the 9.3% mark.
So, forget underperformance, the way SGBs are structured by the GOI, is designed to outperform its benchmark index. That is why, without a doubt, SGB is the best way to invest in gold in India.
Conclusion
We’ve seen the analysis of various investment options in gold, including Gold Mutual Funds, Gold ETFs, Physical Gold, Digital Gold, and Sovereign Gold Bonds (SGBs). We’ve evaluated their performance over a 10-year period and highlighted key considerations for investors.
The analysis revealed that while physical gold can yield better returns than Gold Mutual Funds and Gold ETFs, it is associated with higher upfront costs, such as making charges and GST. However, it also underperforms the gold price index by about 16%, making it less attractive for return-focused investors.
Digital Gold, on the other hand, emerges as a strong contender, outperforming other options with an annualized return of 6.43%. Despite the 3% GST and 3% spread during buying and selling, digital gold offers a competitive return.
However, the standout performer among the options is Sovereign Gold Bonds (SGBs). SGBs not only closely mimic the gold price index, with a 6.96% annualized return over the same 10-year period, but they also provide a 2.5% annual interest, significantly enhancing their overall return potential. This makes SGBs the best way to invest in gold for investors looking for returns and stability.
FAQs
STCG is applicable to gold mutual fund units that are held for 3 years or less. STCG is taxed at the investor’s income tax slab rate. LTCG is applicable to gold mutual fund units that are held for more than 3 years. LTCG is taxed at a flat rate of 20% with indexation.
SGB comes with a maturity period of 8 years. If one holds the SGB till maturity, the gains become tax-free. But GOI, through RBI, would buy back the bond after the fifth year. If one sells their bonds between the fifth and the eighth year, LTCG (20% with indexation) will be applicable. One can also sell the SGB before the end of the third year in the secondary market. In that case, STCG (tax slab) will be applicable. LTCG will be applicable on sales between the third and the fifth year.
Have a happy investing.