
How do you calculate the CAGR for a portfolio? When I first saw this query, I thought, why someone asked this question? Frankly, I misjudged the depth of it. Hence, for a few days, I kept it unanswered. But something told me that there is more to this question than what’s visible. Why? If you are new to the term CAGR, please read here.
Because I knew that in my stock portfolio, the CAGR of the total portfolio is not visible. The CAGR of individual, stocks purchased, was visible. But the CAGR of the whole portfolio was not calculated. I also tried the calculation using the weighted average CAGR method, but the answer did not look correct. By this time it was clear to me that I’m in to solve a small puzzle.
What is CAGR?
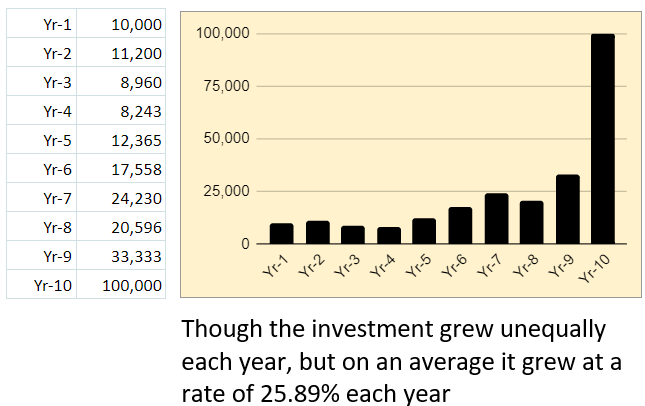
It is an abbreviation for Compound Annual Growth Rate. Suppose an investment grew from Rs.10,000 to Rs.100,00 in ten years. In CAGR terms we can say that it grew at the rate of 25.89% per annum. CAGR is an expression to say how much the investment grew each year.
In our example, when we say 25.89% CAGR, we actually mean that in the first year it grew from 10,000 to 12,589.25. In the second year, it grew from Rs.12,589.25 to 15,848.92. This way, the investment continued to grow for 10-years till it became Rs.100,000 from Rs.79,432 in the 10th year.
CAGR is only a hypothetical way to express the growth rate. In actual world, the investment may have grown differently each year. For example, Rs.10,000 growing to Rs.100,000 might not have grown equally in all years. An unequal growth is also possible as shown in the below infographics. But the use of a CAGR number helps us to easily comprehend the rate of growth.
Traditional CAGR Formula – Unsuitable
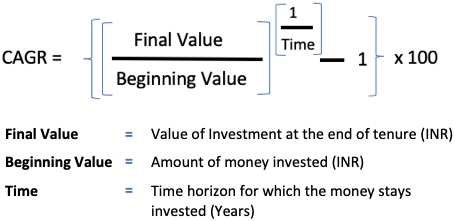
To calculate the CAGR of a stock portfolio, the above traditional formula will not help. Why? To understand this we will have to take the help of an example.
Suppose a person started buying shares of Reliance (RIL) from 2009 onwards. The shares were bought multiple times as shown below. As of today (06-Sep-2022), the portfolio holdings look like this:
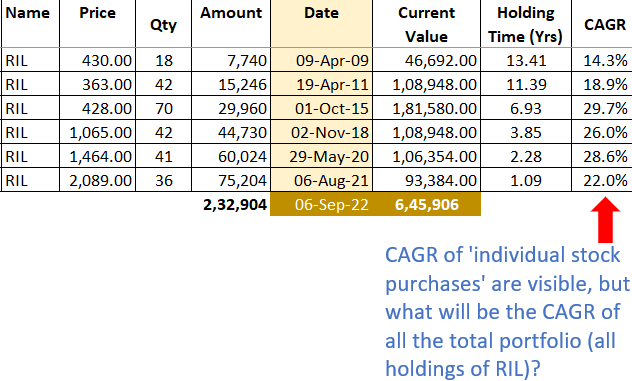
In the last 13-Years, the shares of RIL were purchased six times. The share purchase started on 09-Apr-09 and continued till 06-Aug-21 as shown above. As you can see, the CAGR of individual stock purchases is visible. But what will be the CAGR of all the total portfolio (all holdings of RIL)?
If we will use the traditional CAGR formula, which values will be applicable for the following three variables?
- Final Value: The final value will be the sum of all current values. Hence, we can take this number as Rupees 6,45,906 (at the rate of Rupee 2,594/share)
- Beginning Value: There is no single beginning for this stock purchase. The stocks were purchased at multiple time periods. If we will try to take a sum of the total invested amount (Rupees 2,32,904) as the beginning value, it will be wrong.
- Time: Again, there are multiple buying dates. If we will take the average of the holing time, it will not be correct.
So, the CAGR calculation of this stock portfolio, using the traditional CAGR formula, is not working.
What is the alternative? The use of the XIRR formula. Please continue reading.
The Use of XIRR Formula
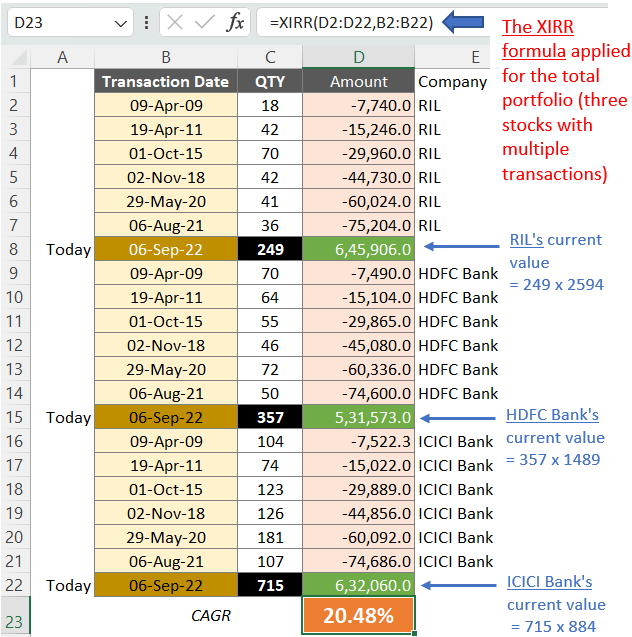
The CAGR of the portfolio can be calculated by the use of the XIRR formula. But before one can apply the XIRR formula to the transactions, the available data must be stored in a certain format. What is the format? It is shown below:
The following steps must be followed to calculate the CAGR (annualized growth rate) of the stock portfolio.
These are the four steps
- Step #1 (Date of Purchase): Keeping a date-wise record of all stock purchases is a must. For example, in the above stock portfolio, the three stocks RIL, HDFC Bank, and ICICI Bank was purchased on multiple dates between the year 2009 and 2022.
- Step #2 (Qty of Purchase): Against each date, note the number of stocks purchased in each transaction. Once values have been entered, note the total number of stocks held as of today. In our example, the total number of stocks purchased between 2009 and 2021 for RIL, HDFC Bank, and ICICI Bank are 249, 357, and 715 respectively.
- Step #3 (Current Value of Investment): In this step, at the end of the transaction for every individual stock, first write the today’s date [=Today() – in excel] under the header marked as “Transaction Date”. Then google the current share price. In our example, the current price of the three companies was Rs.2594, Rs.1489, and Rs.884 respectively. The current value of the investment will be a multiple of the total quantity of shares (Step #2) and the current share price.
- Step #4 (CAGR of a Stock Portfolio): To calculate the CAGR, one must use the XIRR formula of EXCEL. Please check the above screenshot. It clearly shows the use of the XIRR formula for CAGR calculation. The calculated CAGR value of our example portfolio is 20.48% per annum.
Conclusion
In an investment portfolio, multiple buy transactions happen at different dates. Accordingly, the holding period of each transaction differs from each other. Hence, the use of the traditional CAGR formula will not work if we have to calculate the CAGR for a portfolio.
For an investor, it is more effective to watch and monitor the changes in the CAGR of the whole portfolio. Why? Because some constituents of the portfolio will underperform. But as long as the whole portfolio is delivering the expected returns, the investor will be satisfied.
When one of the readers asked me, how do you calculate CAGR for a portfolio, I’m sure he had this clarity because generally, one tracks the CAGR of individual investment. We pay less attention to how the investment portfolio is performing as a whole.
Most DIY investors prefer to record and monitor their investment transactions in Excel or Google Sheets. I’m sure, the method shown above to calculate the CAGR for a portfolio can be easily implemented in these two programs.
Have a happy investing.


This is so useful! Exactly what I was looking for. Thank you so much 🙏.
Can you share an example with sell transactions as well?
Hi Mani,
Thanks for the posting. It really helps. However I have some question when trying on the following simple portfolio:
2/28/2024 $92,603.98 final value
12/31/2010 -$1,566.28 buy
1/31/2012 -$12,197.76 buy
XIRR–> 0.1688505868
After I got CAGR (0.1688505868), I verified it as below:
# of years indv growth
13.16084873 $12,207.71 =$1,566.28*(1+CAGR)^13.16084873
12.07665982 $80,275.42 =$12,197.76*(1+CAGR)^12.07665982
$92,483.13 <– total
As you see, the above total $92,483.13 is a little different from the original final value $92,603.98.
Any idea? Thanks a lot.
XIRR indicates an average value (16.88%) of two separate investments (of 2010 and 2012). In reality, both these funds are growing at different rates.
But when you are calculating the final value of each investment, you are considering a common CAGR of 16.88%.
This is what is causing the a slight variation in the final values.
Thanks for asking.
This is interesting. Do you also include the script details that you might have sold?