
Capture ratio is one of the most understandable financial-ratio in which we (small investors) can gauge a mutual fund’s return from a perspective. I’ll tell you how.
We often pick mutual funds for investment based on their past returns. It is like evaluating a mutual fund based on only one parameter. Which is not enough, right? But anyway, we do it because we do not know another way.
Recently we have developed a tool using which one can compare five mutual funds at a time based on 40+ parameters. Using a tool like this is certainly a step-up from picking funds based on just one parameter (returns).
I would have loved to include the Capture Ratio as one of the parameters in our comparison tool. But unfortunately, it could not come-in due to some limitations.
Hence we decided to blog about this ratio. The point is to make the readers use this ratio for analysis along with our mutual fund compare tool.
Where to get the Capture Ratio?
You will get the Capture Ratio of Indian mutual fund schemes from the morningstar website. These are the step using which you can get there:
- Visit the morningstar India website.
- Then, do the searching for the mutual fund in their search bar.
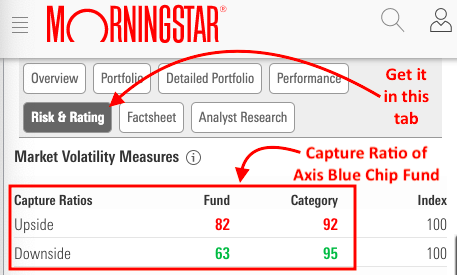
- Go to the ‘Risk & Rating’ Tab.
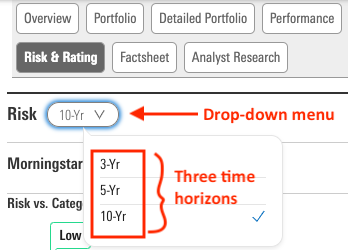
You must also note that the Capture Ratio of mutual funds is available on the morningstar website. The ratio has 3-time horizons: 3-Yr, 5-Yr, and 10-Yr. By default, the website shows the capture ratio for the last three year period. One can use the drop-down menu to select the other periods.
What is Capture Ratio?
It is a measure of how a Mutual Fund Scheme has performed in bullish as well as in bearish markets concerning a benchmark index.
What is the need for this understanding? Even a price chart can give us this clarity. What is the need for a Capture Ratio? Price charts are great, but they may not be as precise as a Capture Ratio. Let’s see the price chart to understand this with an example.
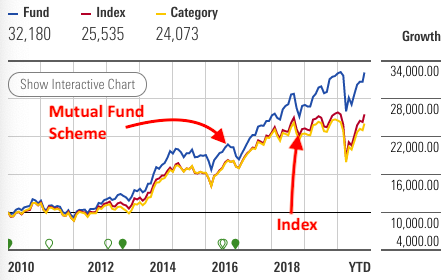
Look at the price chart shown above. Visually, it seems that the mutual fund scheme’s NAV has almost mimicked the index movement, right? So what we will conclude by seeing the chart alone? We will conclude that the mutual fund has replicated the index returns to near perfection.
But the Capture Ratio of this mutual fund scheme will help you to draw a different conclusion. Let me show you the Capture Ratio of the 10-Yr period for the same mutual fund.
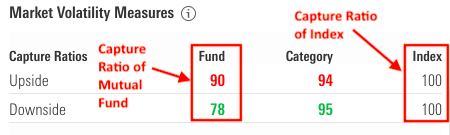
The Ratio has two parts: Upside and Downside ratio.
- Upside: When the upside ratio is less than 100, it indicates a bad performance in a bullish market. When the upside is more than 100, it means the fund has outperformed the index.
- Downside: When the downside ratio is less than 100, it indicates the fund has shown more resistance in a bearish market, hence considered a good performance. When the downside is more than 100, it means the fund underperformed the index.

In other words, we can say that this ratio is a more intricate way of seeing past returns of a mutual fund scheme. Instead of gauging returns only from a point to point, segregation of full-period is done into two types: upsides and downsides. Then it is evaluated how the mutual fund scheme performed in each of these periods (when the index rose and when the index fell).
To better understand the Capture Ratio, let’s read about its calculation methodology. It will give further clarity about the upside and downside-capture-ratio.
How to calculate it?
First, the whole period is divided into months. Then all those months are identified where the mutual fund had a positive return. It is then checked, how the benchmark index performed in these same months. Now, to calculate the upside ratio, the following formula is used:
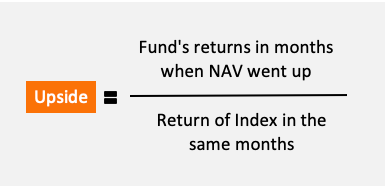
Let’s take a hypothetical example. Between 01-Apr’20 and 30-Apr’20, the NAV of a mutual fund scheme rose by 8.03%. In the same period, the S&P BSE 100 index rose by 10.5%. What will be the Sharpe Ratio of this mutual fund scheme? The answer is 76 (Upside = 8.03/10.5 x 100).
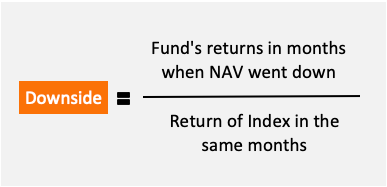
Another example. Between 01-Mar’20 and 31-Mar’20, the NAV of a mutual fund scheme fell by say 16.36%. In the same period, the S&P BSE 100 index fell by 22%. What will be the Sharpe Ratio of this mutual fund scheme? The answer is 74 (Downside = -16.36/-22 x 100).
Decoding the numbers…
As an investor, we would like to see a mutual fund scheme having an upward capture ratio of more than 100. A score of over a hundred is a sign of outperformance. Similarly, the upside capture ratio below 100 means the fund has underperformed compared to an index.
In our above example (Between 01-Apr’20 and 30-Apr’20), the Upside Ratio was 76, so it’s an underperformance. Though the fund yielded a positive return of 8.03%, still its Upside ratio was less than 100. Why? Because it could not beat the return of a benchmark index.
Again in the above example (Between 01-Mar’20 and 31-Mar’20), the Downside Ratio was 74. It is a signal that the fund has shown a smaller negative return than the S&P BSE 100 index. In this period, the S&P Index fell by 22%, but the fund’s NAV fell by only 16.36%. It is indicative of good performance.
Ideal Capture Ratio
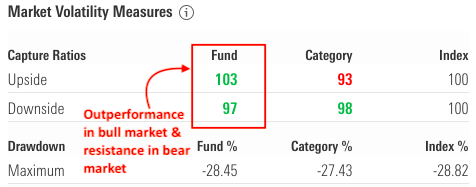
This is an example of the Mirae Asset Large Cap Fund. The three-year Capture Ratio of this fund shows an Upside Ratio of 103 and a downside of 97.
These two numbers indicate that the fund has outperformed the index by 3% in a bullish market. Also, it captured only 97% of the index’s negative returns (in a bearish market).
Above 100 upside-ratio, and below 100 downside-ratio is an example of an ideal capture ratio.
Which indices are used as benchmarks for capture ratio calculation?
Morningstar uses the performance of the following index for the calculation of the ratio:
- Large Cap Funds: They use S&P BSE 100 index.
- Mid-Cap Funds: They use the IISL CNX mid-cap index.
- Small-Cap Funds: They use IISL CNX small-cap index.
- ELSS Funds: They use S&P BSE 200 index.
Conclusion
Mutual fund schemes have a benchmark index attached to it. The Capture Ratio is a tool that we can use to judge a fund’s performance with respect to its benchmark.
As an investor, we would like to see an upside-capture ratio of more than 100 and a downside-capture ratio of below 100. Why? Because otherwise, we will invest in an index fund. Why pay those extra for a higher expense ratio for actively managed funds?
It is also important to note that judging a mutual fund just on basis of the capture ratio of one period (say 3-Yr) will not be fair. Better is to look for a capture ratio of 3-Yr, 5-Yr, and 10-Yr together to take a final call.

my view is, the capture ratio compares the index and hence, instead of investing in active mutual funds, one can invest in index fund because of the funds is following the return based on index. Besides, index funds are categorized as passive mutual funds and have considerably less expanse ratio
You are right. But it is also possible for fund managers to generate alpha for their investors. Good actively managed funds can do that consistently.