Why the Nifty Transportation & Logistics Index Can Better Read The Economy - Thumbnail

Why the Nifty Transportation & Logistics Index Can Better Read The Economy

Summary Points: Tracks 31 companies like Adani Ports and Tata Motors, reflecting the real movement of goods and people. Acts as an economic undercurrent, catching subtle shifts—like supply chain snags or festive demand, before the Nifty50 does. Serves as an early warning system, hinting at market trends while the Nifty50 plays catch-up. Offers a practical…

Understanding Nifty 50’s Journey - Last 28 Years Data - Thumbnail
|

Understanding Nifty 50’s Journey Over the Past 28 Years [December Data]

The performance of the Nifty 50 index over the past 28 years tells a fascinating story of resilience, growth, and volatility. By analyzing this data, we can uncover valuable insights into the nature of long-term investing, the cyclical trends in stock markets, and the impact of major global and domestic events on equity returns. Data…

CAPE Ratio - Thumbnail

Understanding CAPE Ratio: Indian Stock Market

Investing in the stock market can be confusing and complicated. Seasoned investors use tools to understand the market breadth. Among the many tools, market valuation metrics guide decisions most effectively. It helps the investors identify whether a market or a specific stock is overvalued or undervalued. One such powerful metric is the Cyclically Adjusted Price-to-Earnings…

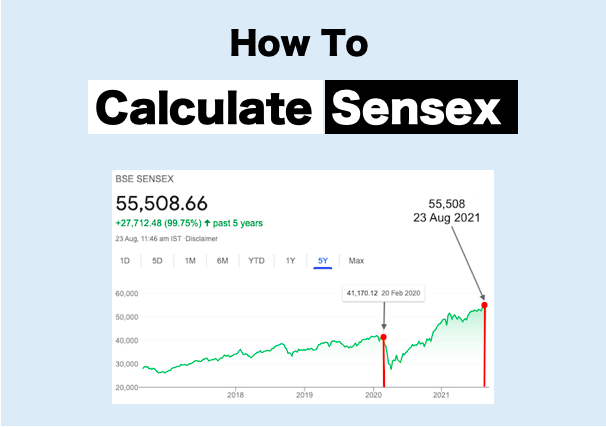
How Sensex is calculated - Image

How Sensex is Calculated?

Since my early days of involvement in the stock market, I was intrigued by the number called Sensex (A BSE Index). I always wanted to know how Sensex is calculated. What is fascinating about Sensex is that, when it is rising or falling, almost all stocks (mainly good ones) seems to follow its trend. I started investing…