
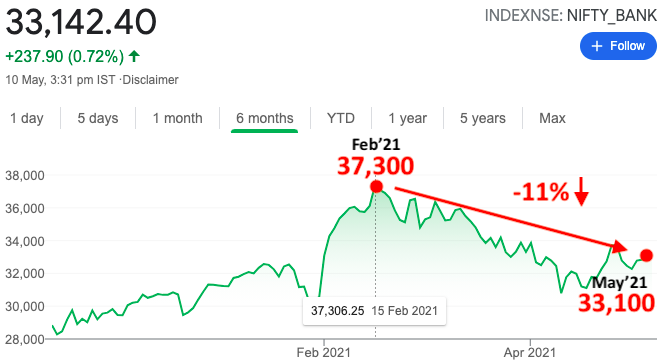
Let’s compare Indian Banks to know which are the best banks and which are avoidable. A Screener for Top 20 Banks. Since 15th-Feb’21 nifty bank has corrected from 37,300 levels to 33,100 levels as of today (10-May’21). This is a correction of almost 11%. [For a broader perspective, check out our guide on Top Stocks to Buy in India.]
As an investor, people can use this correction as a buying opportunity. But we must also remember that COVID-19 will have drastic effects on the bank’s business.
It may not happen that we end up buying a potential Yes Bank or IDBI Bank of the future. Such an investment decision might lead to regrets.
Though it is also true that bank stocks are the safest stocks to buy and hold for the long term. We must only take care to buy shares of a safe bank and at a fair price.
In this article, we will compare Indian banks with each other. For example sake, I’ve considered fifteen (15) banks. Thirteen of them are private banks, and only two are large government banks.
Suggested Reading: India’s Bitcoin (Digital Currency)
The Performance of Bank Stocks (Last 3 Months)
Talking about specific stocks, as of 10-May’21, banks have seen some price corrections (the list is below). The top of the lot is RBL Bank. Though Axis and ICICI Bank remain at the bottom of the list now, in Apr’21 they were also touching Rs.635 (Axis) and Rs.540 (ICICI) levels.
| Name | Price | Change in 3M (%) |
| RBL Bank | 187.55 | -23.87 |
| HDFC Bank | 1,419.85 | -11.91 |
| Bandhan Bank | 295.95 | -9.85 |
| State Bank of India | 361.70 | -8.38 |
| Indusind Bank | 945.40 | -7.84 |
| Kotak Mahindra Bank | 1,809.35 | -7.17 |
| Federal Bank | 79.55 | -4.10 |
| Axis Bank | 715.25 | -3.67 |
| ICICI Bank | 613.25 | -3.17 |
| City Union Bank | 167.35 | 0.42 |
So considering these price corrections as a buying opportunity, should we invest in them? Yes, but the only problem is that we should not get stuck with Yes Banks and IDBI Banks of sorts.
This is the reason why I thought to do a self-analysis on these banks (15 in total). What I found was rewarding. Hence, I thought to publish it for my readers. I hope you will like it.
Basis of Analysis
I’ve used nine (9) financial ratios to compare Indian banks. All these ratios are used by experts to analyze banks.
Most of these ratios are different from the financial ratios that we use to analyze non-banking stocks. So I’ll both compare and give an introduction to the ratios used for comparison.
Ratios used to compare Indian Banks
- #1. Gross NPA & Net NPA
- #2. CASA Ratio
- #3. Provisioning Coverage Ratio (PCR)
- #4. Advance To Deposit Ratio (A/D)
- #5. Equity Multiplier (EM)
- #6. Return – ROA & ROE
- #7. Net Interest Margin (NIM)
#1. Gross NPA & Net NPA
For the banks, the loans issued to people/corporations are an asset. Why? Because it generates income for the bank in the form of interest. When a loan stops generating income, it is tagged as a non-performing asset (NPA).
Bank’s gross non-performing assets (GNPA) is the sum of all loans (principal plus interest) that carry a tag of NPA under its name. Generally speaking, a loan becomes an NPA when its dues remain unpaid for more than 90 days. Read: What happens when the loan is not paid.
Gross NPA is generally expressed as a percentage. The percentage number represents the portion of the total loan which has become an NPA. For example, 11% GNPA means, out of Rs.100 Crore issued as loans, Rs.11 Crore has been identified as NPA.
How do banks deal with their NPAs?
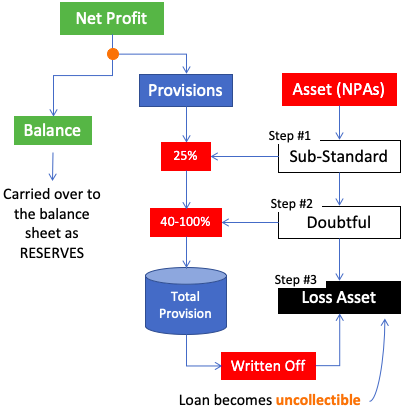
NPAs cause loss to banks. As per RBI’s norms banks must keep a ‘provision‘ for the NPA. Provision is nothing but money kept aside from the bank’s ‘net profit’. If the NPAs ultimately become uncollectible (loss asset), they are written off by adjusting from the provision (see the image above).
There is a rule for keeping provisions. To understand the rule, we must know the three types of NPAs. Depending upon the type of NPA, provision rules have been set.
- Sub-Standard Assets: These are loans that have continued to be an NPA for 12 months or less. For these NPAs banks must keep a 25% provision.
- Doubtful Assets: These are loans that have continued to be an NPA for at least 12 months or more. For these NPAs banks must keep a 100% provision for the unsecured portion and 40% for the secured portion. After the third year, 100% provision must be kept for the entire loan outstanding.
- Loss Assets: These are NPAs which has been classified as ‘uncollectable’ by the bank. The same has also been verified by the auditors, and if necessary, by the RBI. For these NPAs banks must keep a 100% provision. Know more about NPA classification.
Net NPA (NNPA)
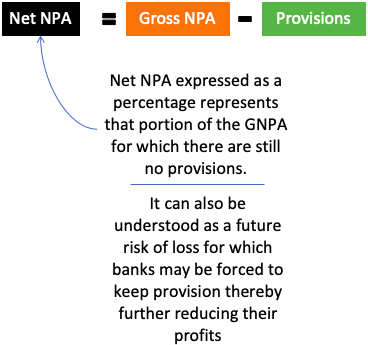
Net NPA expressed as a percentage represents that portion of the GNPA for which there are still no provisions. It can also be understood as a future risk of loss for which banks may be forced to keep provision, thereby further reducing their profits.
The smaller is the GNPA and NNPA number the safer is the bank.
Now that we have understood what is GNPA and NNPA, let’s see how these two numbers look for Indian banks.
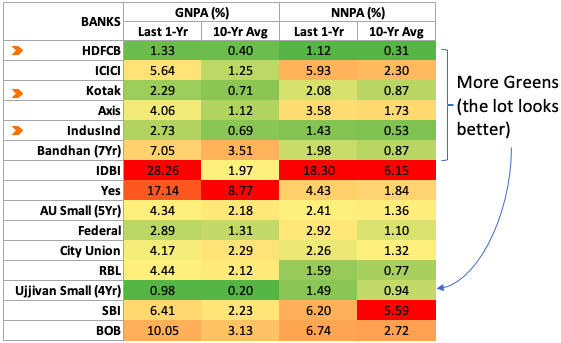
Out of 15 banks in comparison, HDFC Bank looks best in terms of GNPA and NNPA. Followed by IndusInd Bank and Kotak Mahindra Bank.
[P.Note: Individuals and companies will show more faith in a bank that has a low GNPA and NNPA. Such banks will see more retail savings accounts opened in their branches. Companies also will show their faith in such banks by opening current accounts. As a result, the CASA ratio of such banks will become high.]
#2. CASA Ratio
The business model of banks is to collect deposits at a low cost and lend this money to the borrowers at a higher rate of interest.
First, to collect deposits the bank must attract people and companies to open bank accounts in their branches. Once the account is opened, banks would get deposits from the account holders.
There are mainly four types of deposits: (a) Current A/c, (b) Savings A/c, (c) Fixed Deposit, and (d) Recurring Deposit. Out of these four deposit types, the current account offers zero interest rates. The savings account offers a minimal interest rate of 3-4% per annum. Fixed and recurring deposits offer higher interest rates.

The higher is the CASA Ratio the better. As an investor, we must look for those banks which are continuously improving its CASA ratio. A higher CASA ratio indicates that the bank has a cheaper source of funds (deposits). A cheaper source of funds would mean that the bank will yield higher Net Interest Margins (NIM) – an indicator of profitability.
Let’s see what is the CASA ratio for our 15 banks in India:
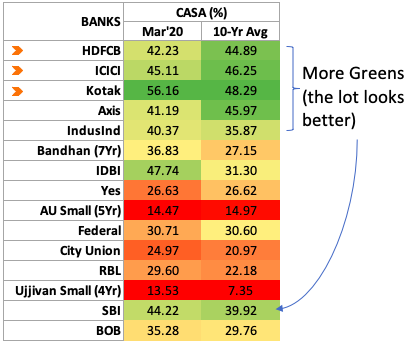
Out of 15 banks in comparison, Kotak Mahindra Bank looks best of the lot. It is followed by HDFC Bank, ICICI Bank and SBI. IDBI being an Industrial Bank, has higher proportion of current accounts. Hence, its CASA numbers are also high.
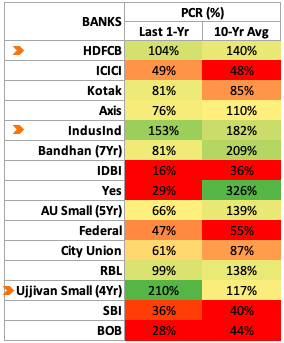
#3. Provisioning Coverage Ratio (PCR)
It is a ratio that indicates what portion of the Gross NPA (GNPA) is already protected by the “Provisions” set aside by the bank. A combination of high PCR, high ROA/ROE, and high NIM makes it desirable for investing.
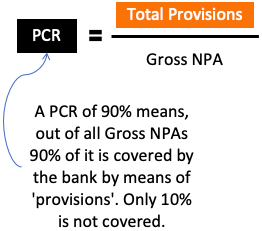
PCR is a ratio between total provisions and gross NPA of the bank. Both provisions and gross NPA numbers can be picked from the company’s balance sheet. A PCR of 90% means, out of all Gross NPAs 90% of it is covered by the bank by means of ‘provisions’. Only 10% is not covered.
Let’s see what is the PCR ratio for our 15 Indian bank:
Ujjivan Small Finance Bank has the best numbers of all. But it is a new bank. We have only 4 years data of the bank for comparison. Among other banks, HDFC Bank and IndusInd bank looks properly covered by provisions. Though I must also mention that HDFC Bank had anyways lowest GNPA and NNPA numbers.
#4. Advance To Deposit Ratio (ADR)
Banks collect deposits from account holders and issue them as loans (Advances) to people/companies who need them. A bank that collected Rs.100 crore in deposit, and issues Rs.90 crore as loans will have an A/D ratio of 0.9.
The lower is the ADR the safer is the bank. But low ADR will also adversely impact the bank’s NIM and hence returns (ROA and ROE). So, it is necessary for banks to keep a balance between ‘low ADR’ and ‘high NIM.’
Let’s see what is the ADR for our 15 Indian bank:
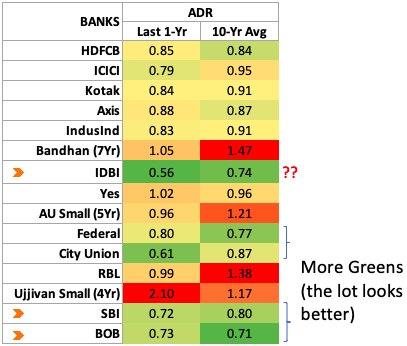
The two government banks (SBI and Bank of Baroda) have faired well in ADR. But a low ADR number like that of IDBI Bank is also not good. We must ask, why the bank is not issuing loans? In the last years, it has issued only 56% of its deposits as loans. The balance 44% was sitting idle in the bank?
#5. Equity Multiplier (EM)
If we will see the balance sheet of a bank, it will have two components as a source of funds: equity and deposits. The equity component is also called shareholders funds (net worth). It consists of share capital and reserves.
Deposits are funds parked in the various current accounts, savings accounts, FD’s, and RD’s of the bank.
A sum of equity and deposits is the total capital available with the bank to do business. How the bank does business? By issuing loans to the public and corporations.
The ratio between total capital and total equity is called Equity Multiplier (EM = Total Capital / Total Equity).
As a rule of thumb, if the equity multiplier of a bank cross 15, the bank may be considered risky.
Let’s see which of our 15 banks are satisfying the EM-15 rule:
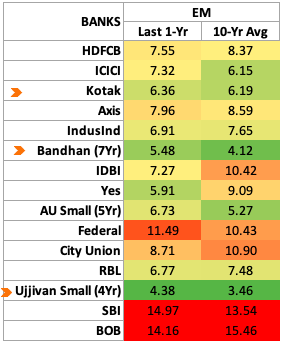
In terms of equity multiplier, Ujjivan Small Finance, Bandhan and Kotak Mahindra bank looks safest.
#6. Return on Asset (ROA) & Return on Equity (ROE)
If you want to know about the basics of ROA, and ROE please check the provided links. Here, I’ll like to jump straight to the ROA & ROE comparison of our 15 banks.
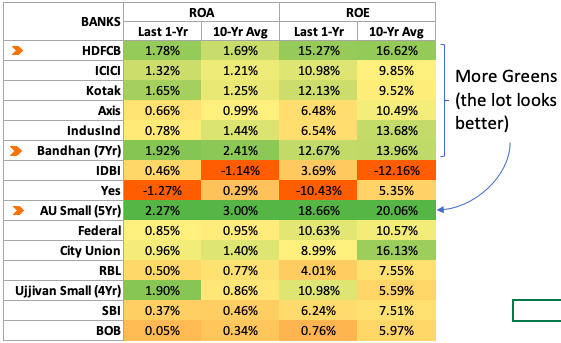
In terms of ROA and ROE numbers, the big private banks score high. HDFC Bank, Bandhan Bank, and AU Small Finance Bank are the clear winners. Nevertheless, ICICI and Kotak Bank’s returns are also fair.
The older and bigger the bank gets with time, the difficult it is for them to maintain their ROA and ROE numbers. In this regard, the performance of HDFC Bank and ICICI Bank is par excellence.
AU Small Finance Bank is a very new and small bank, hence we cannot compare them with HDFC and ICICI. But yes, its numbers are good. Bandhan and Ujjival Small finance Bank has almost the same year as AU Small Finance bank but their ROA & ROE number are smaller.
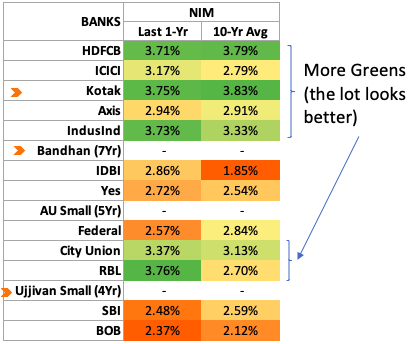
#7. Net Interest Margin (NIM)
For banks and financial institutions, their main business is to collect interest (from loans) and pay interest on deposits.
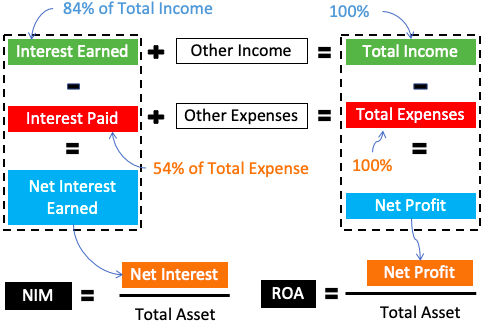
If we will observe the bank’s P&L Account, we will find that the main source of income is “interest”. For HDFC Bank, in the last 5 years, the average income earned as ‘interest’ is 84% of its “total income”.
Similarly, in the last 5 years, the average interest paid by HDFC Bank was 54% of the total expense.
Hence, “interests” being the main component in the income and expense side, banks and financial institutions are better judged for profitability by a ratio called net interest margin (NIM).
NIM is a measure of how efficient are the assets of the bank to generate net interest (Net Interest = Interest Earned – Interest Expended).
NIM = Net Interest / Total Assets
The higher is the NIM, more efficient is the bank.
Let’s see how our 15 banks compare on the parameter of NIM:
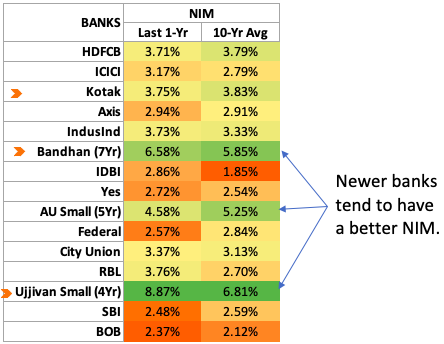
In the comparison, you can see that the newer banks tend to do better. Banks like Bandhan, AU Small, and Ujjivan Small are showing better numbers.
Now, if we will remove these 3 banks from the list, what will remain are only those banks that have at least 10-Yrs data for comparison. In this case, the NIM comparison looks fairer. All top Indian private banks seem to score higher. Even the smaller banks like RBL and City Union have decent NIM.
Conclusion
The biggest bank in India is State Bank of India (SBI) followed by HDFC Bank. But unfortunately the two banks have less in common. In terms of banks efficiency and profitability, HDFC Bank is far ahead of SBI.
Here is a quick glance at how all 15 banks looks in comparison.
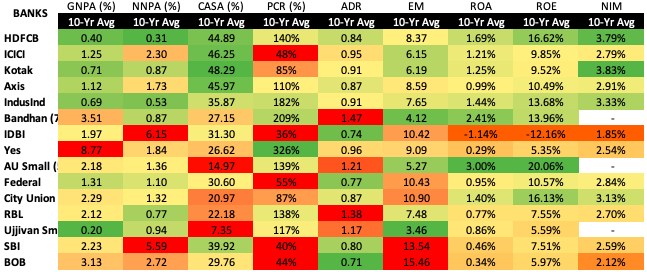
As an investor, it is easy to see that the big private sector banks HDFC Bank, ICICI, Kotak, Axis and IndusInd Bank fare well compared to others.
Among smaller banks, Bandhan, and AU Small Finance competes well with the biggies.
I hope you liked the comparison of our top 15 banks. According to you, which bank looks better. Please leave your answer in the comment section below.
Have a happy investing.
Suggested Reading:
![How To Build A Winning Stock Portfolio [India]](https://ourwealthinsights.com/wp-content/uploads/2010/06/Stock-Portfolio-Image.png)


It will be very helpful, if you can bring this analysis on annual basis around June/July each each years when the annual results of all big banks will be available.
Awesome stuff. Thanks for details. Would it be possible for you to update the numbers for 2022?
Mani, very clearly and nicely written. But there is an issue with the NIM formula shown. NIM is NII/INTEREST bearing assets, which, for a bank, are loans. Not total assets, which include physical assets such as property. Do correct.
Thanks, Anjali
Dear Sir,
Very nicely you are pointing the investment Market in a different way which I have believed since my education. I could not find any major reason for the change in the stock price on an hourly basis or rather in every millisecond. The company’s Profitability or the ROI or the intrinsic value of its share do not change frequently. But it happens. With respect to Banks, so many audit works are there to check the work of the banks but suddenly we find the crores of public investment got valueless due to sudden true secret matters come out in the light from the dark. You know, the Auditors are auditing and we are finding and analyzing that very audited data for taking our decision for the investment. The few corrupt auditors help the company to become bankrupt all of a sudden. You know, some of the auditors are crying for continuing the audit work to safeguard the govt. revenue etc….. Sorry to say that everything is right but our time taking judicial system and the punishment with its’ quality must be rearranged by the lawmakers, had they actually want the betterment of the people/banks/country in all respect. Very nice article of the bank, you have presented to all and thanks a lot to you.
Your perspective has added a new shade to the concept. Thank you for posting your views.
Banks GNPA % NNPA %
Last 1 year 10-yr avg Last 1 year 10-yr avg
HDFCB 1.33 0.04 1.12 0.31 WRONG
HDFCB 1.33 1.12 0.04 0.31 RIGHT
Having gone through the article about banking parameters efficiency measures found very useful contents and find HDFC Bank as best Bank overall.. The article is educative &explained nicely
Thanks.
Great Post!
Wanted to know where can we see the GNPA & NNPA data?
Dear Mani, I have been following your blogs for more than couple of years.
Here facts are presented in very simple way which is easy to understand.
Thanks you so much for your endeavor to share your knowledge.
THANK YOU
Hi Mr. Mani(sh),
Your efforts in producing such detailed study and explanation is most useful to common investor like me.
Excellent and well presented for anyone to understand.
Keep up the good work.
God Bless.
Thank you.
Awesome work.You always make things simple..that’s the beauty…….Thanks.
Thank you
meticulously studied & proved.. helpful
thanks
Thank you for posting your feedback
Your assessment of banks is awesome; the best I have come across so far. It must have taken you a lot of time and effort to prepare the report. Thanks.
Yes, it took some findings to prepare the post.
Thank you for posting the comment.