How To Track Stock Portfolio with Google Finance & Google Sheets
NSE:TCS, NSE:RELIANCE). Use the =GOOGLEFINANCE() function to fetch real-time data. For example, enter =GOOGLEFINANCE("NSE:TCS", "price") to get the current price. Add columns for other attributes like volume or P/E ratio, and update regularly for accurate tracking.
=GOOGLEFINANCE(ticker, [attribute]) function in Google Sheets retrieves real-time or historical stock data. For Indian stocks, use NSE tickers (e.g., NSE:INFY). Example: =GOOGLEFINANCE("NSE:INFY", "price") returns the current price. Attributes like "price", "volume", or "pe" provide specific metrics. Check Google’s support page for a full list of attributes.
"price" (current stock price), "changepct" (percentage change), "volume" (trading volume), "pe" (P/E ratio), "eps" (earnings per share), "high" (day’s high), "low" (day’s low), and "marketcap" (market capitalization). These help monitor performance and fundamentals of stocks like NSE:HDFCBANK or NSE:SBIN.
=GOOGLEFINANCE("NSE:stock_symbol", "price"). For example, =GOOGLEFINANCE("NSE:TCS", "price") fetches the current price of TCS. Ensure the ticker is prefixed with NSE: for Indian stocks listed on the National Stock Exchange.
=GOOGLEFINANCE("NSE:stock_symbol", "price", start_date, end_date, [interval]). For example, =GOOGLEFINANCE("NSE:RELIANCE", "price", "2025-01-01", "2025-05-01", "DAILY") retrieves daily closing prices for Reliance Industries between January 1 and May 1, 2025. Use this to analyze past performance.
(Current Price - Purchase Price) / Purchase Price. Fetch the current price with =GOOGLEFINANCE("NSE:TCS", "price") in one column, input your purchase price in another, and compute returns in a third column. For example, if you bought TCS at ₹4000 and the current price is ₹4500, the return is =(4500-4000)/4000, or 12.5%.
=GOOGLEFINANCE("NSE:stock_symbol", "pe"). For example, =GOOGLEFINANCE("NSE:INFY", "pe") returns the P/E ratio for Infosys. Add this to your Google Sheets tracker to compare valuation across stocks like NSE:HDFCBANK or NSE:BAJFINANCE.
=GOOGLEFINANCE("NSE:stock_symbol", "changepct") to get the daily percentage change. For example, =GOOGLEFINANCE("NSE:SBIN", "changepct") shows the percentage change for State Bank of India. Combine with "price" to see absolute changes.
=GOOGLEFINANCE("NSE:stock_symbol", "volume"). For example, =GOOGLEFINANCE("NSE:RELIANCE", "volume") shows the trading volume for Reliance Industries. High volume can indicate market interest or volatility.
=GOOGLEFINANCE("NSE:stock_symbol", "marketcap"). For example, =GOOGLEFINANCE("NSE:TCS", "marketcap") returns the market capitalization of TCS. This helps assess the size and stability of companies in your portfolio.
=GOOGLEFINANCE("NSE:stock_symbol", "dividend") / GOOGLEFINANCE("NSE:stock_symbol", "price"). For example, for NSE:HDFCBANK, this gives the dividend yield. Check company reports for accurate dividend data.
GOOGLEFINANCE data reflects post-split prices.
=GOOGLEFINANCE("NSE:stock_symbol", "price", start_date, end_date) to create a data table. Select the data, go to Insert > Chart, and choose a line or candlestick chart to visualize trends for stocks like NSE:INFY or NSE:RELIANCE.
NSE:TCS. Always prefix with NSE: in GOOGLEFINANCE formulas to ensure accurate data retrieval.
=GOOGLEFINANCE("NSE:stock_symbol", "price") in another. Multiply shares by price (e.g., =A2*B2) and sum all values with =SUM(C2:C10) to get the total portfolio value.
=GOOGLEFINANCE("NSE:stock_symbol", "high52") and =GOOGLEFINANCE("NSE:stock_symbol", "low52"). For example, =GOOGLEFINANCE("NSE:BAJFINANCE", "high52") shows the 52-week high for Bajaj Finance, helping you assess price ranges.
GOOGLEFINANCE data in real-time during market hours. Ensure your formulas (e.g., =GOOGLEFINANCE("NSE:TCS", "price")) are correct, and refresh the sheet to fetch the latest data. For historical data, set specific date ranges.
"pe", "eps", "marketcap", and "changepct" using =GOOGLEFINANCE(). For example, compare NSE:TCS and NSE:INFY by fetching their P/E ratios and sorting or filtering the table to identify outperformers.
NSE:RELIANCE) on nseindia.com, ensure the attribute is valid (e.g., "price"), and check your internet connection. If errors persist, try refreshing the sheet or using a different ticker.
=GOOGLEFINANCE("NSE:stock_symbol", "sector") (if available) or manually categorize stocks by sector (e.g., IT, Banking, Energy). Fetch market cap and P/E ratios to balance large-cap (e.g., NSE:TCS) and mid-cap stocks (e.g., NSE:MINDTREE). Allocate investments across sectors to reduce risk.
Introduction
Till Nov’2017, Google Finance provided excellent tools for portfolio tracking and stock screening. But Google decided to discontinue this service since then. If you want to know about the discontinued features of Google Finance, you can read this blog post.
People like me were a die-hard fan of Google Finance’s stock screener. I used to track all my stock holdings in their portfolio tracker.
Though I’ll admit that their portfolio tracker was not awesome, but due to continued usage, I became a habitual user of it. I’m sure there were many people like me, who would have wanted the Google Portfolio tracker to continue. But anyways, it saw its demise.
So people like me did what? Where we migrated after Google Finance? I know, majority went to use other services like Yahoo Finance etc. But I remained with Google Finance. How? I started using Google Finance in Google Sheets
Why Google Finance?

[Check my Online Stock Analysis Tool – The Stock Engine]
As I told you, I was almost a habitual user of Google Finance from my earlier days of stock investing. Hence, a transition to another service provider was a task.
But more than my personal limitation, there was something else which held me with Google Finance – it is called Google Finance Attributes. Using these attributes, I was able to create an almost duplicate portfolio tracker (like Google Finance) in Google Sheets.
Once I was able to create my stock’s portfolio in Google Sheets, I could see no reasons to switch to any other service provider.
In this blog post, I will explain in brief how I built my Google-Finance-like portfolio tracker in Google Sheets.
Steps to build a portfolio tracker
There are two steps necessary to build a portfolio tracker in Google Sheets.
A trained mind can create a template, and start tracking stocks performance in less than 30 minutes.
It only takes time for the first stock. The balance are almost a copy-paste tasks.
So let’s see the two steps:
- Step #1 – Fetching Data: Before we can start tracking performance of our stocks in Google Sheets, we must build a template in which the relevant stock data can be fetched (over internet). How to fetch the data? Using Google Finance Attributes. We will see the details later.
- Step #2 – Prepare Report Sheets: The old Google Finance theme had three main reporting sheets, they were named like this: (a) Overview, (b) Fundamentals, and (c) Performance. When I built my stock’s portfolio tracker, I exactly duplicated the overview and fundamental reports. I made my customised changes in Performance reporting.
In the next portion of this article, you will get further detailing of the above 2 steps.
[Do you know you can use EXCEL formulas to get your investment answers, check out how.]
Step #1: Fetching Data (Database Sheet)
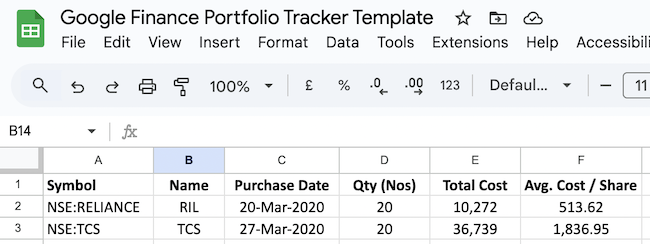
The above is a template which I use to fetch stock data in Google Sheets. What you can see above is the data of two stocks TCS and RIL. Let’s see how to prepare this template:
- Create a Duplicate Template: Open your Google Sheets and prepare a format same as above. Copy the columns marked as “SL and Attributes”. Take special care to copy the info from SL 7 to 24 (without spelling errors). You can also get this data in Google support page. Additional notes are here:
- Symbol: This is the stock ticker. Type the name of your stock in Google Search, you will get the ticker name. Manually enter this data in your google sheet.
- Name: This is the name of your stock. Example: For ticker “NSE:TCS”, the full name will be Tata Consultancy Services. Manually enter the name in your google sheet.
- Purchase Date: This is the date on which you have purchased your stock. Manually enter this data in your google sheet.
- Qty (nos): This is the number of stocks you have purchased on the above date. Manually enter this data in your google sheet.
- Total Cost: This is the total cost (including brokerage, taxes etc), you paid to buy the above number of stocks. Manually enter this data in your google sheet.
- Average Cost Per Share: This is cost per share you paid to buy the above stocks. Use this formula to calculate average cost per share ( = Total Cost / Qty).

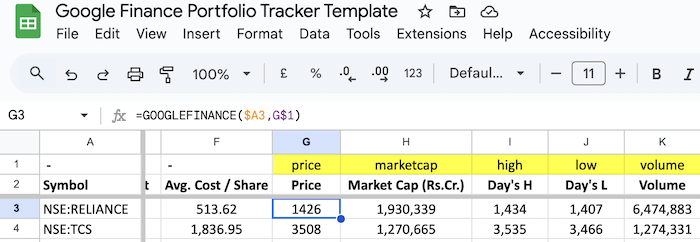
- Fetch Data: Which are the stock’s data that can be fetched using Google Finance? All attributes shown in serial number 7 to 24 can be fetched. How to do it? By using a simple formula. Above I have shown how to fetch “price” data of TCS. Below you will get formulas for few more attributes:
- Price: =GOOGLEFINANCE($A3,G$1)
- Market Cap: =GOOGLEFINANCE($A3,H$1)/10000000
- Day’s High: =GOOGLEFINANCE($A3,I$1)
- Day’s Low: =GOOGLEFINANCE($A3,J$1)
- Volume: =GOOGLEFINANCE($A3,K$1)

In case you want to know more about using the Google Finance formulas, check the support page of Google.
Once you are done here, you have fetched the stock data in your google sheets. Now you are ready to create the report sheets.
Step #2 – Prepare Report Sheets
[Learn how you can analyse your stocks on your own using MS EXCEL.]
There are 3 report sheets: ‘Overview’, ‘Fundamentals’, and ‘Performance’. I will explain how I’ve prepared the Performance report sheet. Using this information, it will be easy for you to prepare the ‘overview’ and ‘fundamentals’ reports.
To prepare the Performance report, I have used the “HLOOKUP” formula of Google Sheets. It is similar to HLOOKUP formula of MS Excel.
Why HLOOKUP formula is used? In Step #1, we have fetched stock’s data from internet into our Google Sheets. This has become our main database (I have also named this sheet as Database). Now, we will use HLOOKUP function to pick relevant information from our ‘database sheet’, to other repot sheets.
Performance Sheet

The header of the performance sheets looks like shown above. You must copy the same in your google sheet.
Please note the numbers written on top of the headers. These numbers are the serial numbers indicated in Step#1 (see fetching data template).
What is the use of these numbers? Example:
- “Number 7” indicated above ‘Latest Price’ means, in this column we will call “price” data from the ‘Database Sheet’ using HLOOKUP formula.
- “Number 6” indicates, we will call “Avg Cost / Share” from the ‘Database Sheet’ using HLOOKUP formula..
Let’s see how this is done:

Let me show you what it means by “Database!$D$2:$J$25” visible in the above highlighted formula. Check the below pic.

To learn more about HLOOKUP function of Google Sheets check this support page.
Overview Sheet
How the ‘overview sheet’ looks, is shown below. You can use the same HLOOKUP function explained above to generate the overview report.

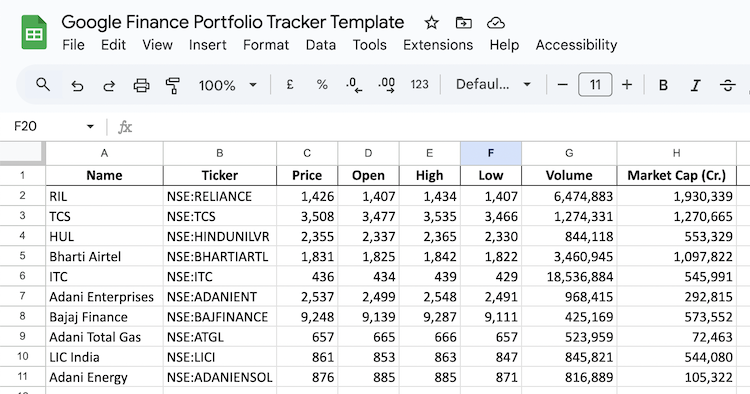
Which value will appear in the overview sheet? Price, Change, Market Cap, Volume, Open price, High price, Low price, and Day’s Gain.
In the above sheet all data will be pulled by HLOOKUP formula from the main Database sheet, except for “Day’s Gain”. This must be calculated using this formula = Change/Price.
How to use HLOOKUP formula? Check the explanation given for the Performance Sheet.
Fundamentals Sheet
In this sheet all data is pulled from the main Database sheet using HLOOKUP formula. Nothing needs to be calculated manually.

Which value will appear in the overview sheet? Price, Change, Market Cap, Average Volume, 52 Wk High, 52 Wk Low, EPS, P/E, and Beta.
How to use HLOOKUP formula? Check the explanation given for the Performance Sheet.
Final Words
Apart from the above set of reports, I also use Google Sheets and Google Finance Attributes to generate the stocks ’10 year price data’. Why I do it? Because it helps me to gauge how the price of stock as performed in last 10 years.
How 10 years price data can be fetched? Use the formula shown in the below graphics:

Once the price data is available, one can also generate the 10 years price chart as shown below. This is the 10 Year price chart of TCS. It gives a good idea of how the price has behaved in long term:

I hope you’ve found this article helpful. It will be great if you can leave your comment below.
Have a happy investing.
Handpicked Articles:


I found great pleasure in reading your thoughtful blog article. The views and concepts you expressed were tremendously useful.
I greatly enjoyed reading your blog post. Your insights were incredibly helpful, and the way you presented them really resonated with me.
Sir, Is there is any formula to get face value of stock in google finance. Pl let me know.
No, there are no google finance attributes for face value
How to link sector to a NSE stock using google finance. Please provide
Hi, is there any way to track the shares/mutual funds that are not in google finance?
How to include PE ratio and ROE/ROCE
Hey Mani,
Thanks for this handy trick, it’s very useful. I wan wondering can you create crypto portfolio just like this?
Is there any formula, to get the moving avg of stocks for 20,30, 50 days in the google finance.
It can be calculated using the price attribute
Sir mere liye google sheet bana dijiye
Smallcap >250
Market Capitalization >1000
Weekly % cheng price
2 Weekly %
Monthly %
This facility is now directly available in latest version of Excel. Data is directly picked by from NSE
What is the formula of Exponential Moving Average (EMA) in Google sheet ?
How it can be used to calculate Share market stock EMA of different period. Eg 5, 21, 50 Days.
Can anyone share Demo sheet.
Thanks 🙏🏻
Excellent guide. Please elaborate further about fetching the historical data of last 10 years or from the day the stock was listed if less than 10 years more clearly. Does it require a separate sheet or the same database sheet. And how to construct the interactive graph . thanks a lot.
PS: A fresh screenshot might be more helpful
Hi, When I add the same stocks (say ITC) bought at two different dates in the database sheet, the HLOOKUP in the performance sheet always picks the stock that appears first. Is there a solution other than limiting the HLOOKUP range?
why beta value is # N/A, is not calculated?
It may be caused due to error in google’s data fetching…
Sir
Fetching live data from google finance is really awesome. Thanks for the guidance. with the help of you I have started learning the nitty gritty of stock market.
you have really worked hard to educate people like us, who want to invest in the stock market.
Thanks
I HAVE LONG TERM PORTFOLIO OF SHARES,MY FULL TIME PROFFESSIOUN IS INVESTMENT IN THE INDIAN STOCKMARKET,I HAVE A LONG TERM GOAL SO I THINK GOOGLE FINANCE WILL HELP ME TO ACHIEVE THIS
THANK YOU