
As investors, we’re all searching for that sweet spot – companies poised for significant growth, right? But how do we distinguish genuine growth potential from fleeting hype? It’s a challenge, and honestly, relying on just gut feelings or popular opinions is like navigating a maze blindfolded. That’s precisely why I poured my experience into building the Stock Engine, a tool designed to cut through the noise and provide a clear view of a company’s fundamentals.
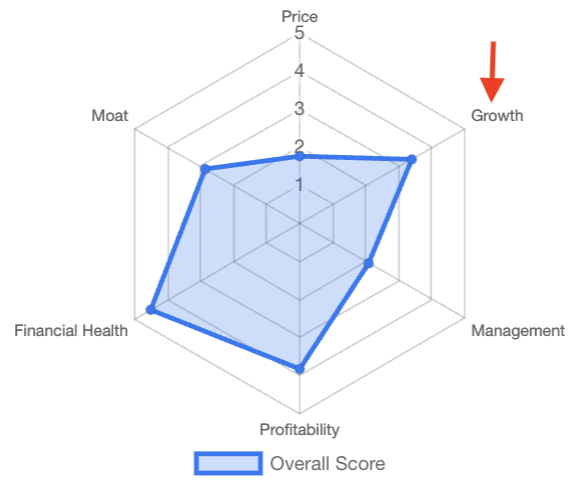
One of the most critical pieces of this system is the Growth Algorithm. It’s a specialized model I’ve developed to systematically analyze a company’s historical performance and assign a reliable “Growth Score.” This score, ranging from 0 to 5, acts as a guide. It can point us towards businesses that are not only growing but doing so in a consistent and sustainable manner.
It’s not enough to see a company’s revenue chart going up and to the right. We also need to make sure they are doing this with profitability and strong cash flows.
This blog post is my attempt to pull back the curtain and show you exactly what goes into this critical algorithm.
By understanding the nuts and bolts of how the Growth Score is calculated, you can confidently use the Stock Engine to make informed decisions.
Let’s dive in.
Table of Contents
#1. What is the Growth Algorithm?
At its core, the Growth Algorithm within the Stock Engine is a specialized model designed to cut through the complexities of a company’s financial statements and deliver a straightforward “Growth Score“.
Think of it as a rating system, where each stock is assigned a score ranging from 0 to 5. This score reflects the quality and sustainability of a company’s growth.
But how does it arrive at that score?
The algorithm achieves this by meticulously analyzing seven key financial metrics that offer insights into a company’s growth trajectory. These metrics are:
- Sustainable Growth Rate (SGR): This is the growth a company can achieve using its own profits without relying on external funding.
- Revenue Growth Rate (RevG): How quickly a company’s sales are increasing.
- EBITDA Growth Rate (EBITDAG): The growth of earnings before interest, tax, depreciation, and amortization, a measure of core operating performance.
- PAT Growth Rate (PATG): The rate at which a company’s profit after tax is growing.
- EPS Growth Rate (EPSG): How much the earnings per share are increasing.
- Net Worth Growth Rate (NWG): The pace at which the company’s total assets minus liabilities are growing.
- Operating Cash Flow Growth (OPCFG): The growth in cash generated from a company’s operations.
These seven metrics are like pieces of a puzzle. Each provides a unique view of a company’s growth story.
The algorithm analyzes each of these metrics, not just at one point in time, but also looks at their historical trends. Specifically, it considers both the trailing twelve months (TTM) values and the past five years of data to paint a complete picture.
In the next part, we’ll go deeper into each of these metrics and understand how they are calculated, normalized, and scored.
#2. Deep Dive into Each Metric
Now that we’ve established the core components of the Growth Algorithm, let’s delve into each of the seven metrics, understand how they are measured, and see why they are so important.
#2.1 Sustainable Growth Rate (SGR)
Think of SGR as the rate at which a company can expand its operations using its own profits, without needing to take on more debt or issue new shares. This metric is crucial because it highlights businesses that can grow sustainably and are not relying on external sources for growth. If you want to know more about the Sustainable Growth Rate (SGR) concept, read this article.
Why SGR Matters: SGR helps you filter out companies that might be growing too quickly by relying heavily on debt or unsustainable methods. A high SGR score means the company has a stable, self-funded growth model.
The calculation is done using the following formula:
SGR = (W1 * ROE + W2 * ROCE) * (1 – Dividend Payout Ratio)
- While ROE (Return on Equity) primarily reflects returns to shareholders, incorporating ROCE (Return on Capital Employed) acknowledges the company’s efficiency in using all its capital. I think, it provides a more holistic view of its sustainable growth potential. This also allows us to penalize companies that are generating good returns for shareholders but not efficiently utilizing its debt capital.
- Dividend Payout Ratio: The percentage of earnings a company distributes to shareholders as dividends.
Why does this formula make sense? Well, ROE and ROCE represent the ability of the company to generate profits. But a company may decide to give this profit as dividends, which reduces the amount of money available for reinvestment for further growth. So, we also consider the 1 – Dividend Payout Ratio portion of the formula.
The Normalization Process for SGR
It’s not enough to just plug in the numbers in the above formula, because it can be misleading. This normalization process is what makes the algorithm of the Stock Engine unique. You can see, it is easy to calculate SGR from the above formula. But what’s the real work of the algorithm does into normalizing the reported numbers. It is done to enhance its reliability.
Here’s how it works:
- Median Values: The algorithm calculates the median values of ROE, ROCE, and the Dividend Payout Ratio using data from the past five years. This helps to smooth out any short-term fluctuations.
- Volatility Adjustment: The standard deviation of these median values are calculated to adjust for any inconsistencies and to identify whether a company is consistently reporting good numbers or not.
- Trend Analysis: The algorithm also takes into account negative values of ROE, ROCE, and dividend payout ratio, and any declining or fluctuating trends.
Based on the above factors, the calculated SGR value are then normalized. Each stock is given a score on a scale of 0 to 5.
A higher score indicates a healthier and more sustainable growth rate.
#2.2 Other Growth Metrics and Their Normalization
Now, let’s look at the other six growth metrics the algorithm considers.
For each metric, the algorithm analyses its TTM (trailing twelve months) value and also uses a five-year trend analysis.
Here’s a breakdown of each:
- Revenue Growth Rate (RevG): This metric measures the percentage change in a company’s sales over a period. It tells us how quickly the company is expanding its customer base.
- EBITDA Growth Rate (EBITDAG): EBITDA stands for Earnings Before Interest, Taxes, Depreciation, and Amortization. This measure tells us how efficiently a company is making profits from its core operations.
- PAT Growth Rate (PATG): This is the percentage change in a company’s profit after all expenses and taxes have been taken into account. It indicates how much profit a company is actually making.
- EPS Growth Rate (EPSG): This represents the percentage change in a company’s earnings per share. This metric is very crucial for retail investors, because it shows profitability on a per-share level.
- Net Worth Growth Rate (NWG): This measures the pace at which a company’s net worth (total assets minus total liabilities) is growing. A healthy and rising net worth shows a company’s financial stability.
- Operating Cash Flow Growth (OPCFG): This represents the percentage change in cash flow from a company’s core operations. It is important because the profit numbers of companies are just accounting entries. If profits are not backed by real cash, then that’s a problem.
How Normalization Improves Accuracy
For each of the above six metrics, a normalization process is used.
These steps ensure that we’re assessing the “quality” of the growth, and not just the rate of growth:
- Five-Year Trend Analysis: The algorithm analyzes the growth rate over the past five years to understand the consistency of the growth.
- Year-over-Year (YoY) Consistency Check: The algorithm checks the consistency of growth over the years. A steady year-on-year (YOY) growth is preferred over random spikes.
- Adjustment for Company Age: Newer companies are given a discounted score, as their early growth may be higher than established companies. We give more weight to companies that have consistently reported revenue and profits for the past 5 years.
Based on the normalized values for RevG, EBITDAG, PATG, EPSG, NWG, and OPCFG, each stock is assigned a score between 0 to 5.
All of these steps give us a complete and holistic view of the growth of each company. In turn, it helps to assign a reliable growth score to each stock.
#3. Creating The Growth Score [Combining The Metrics]
Now that we’ve explored each of the seven individual growth metrics and how they are normalized and scored, it’s time to understand how these scores are combined to arrive at the final Growth Score for a stock.
The Stock Engine uses a weighted average method to accomplish this.
#3.1 What is a Weighted Average?
A weighted average means that not all metrics are treated as equally important. Some metrics, like the Sustainable Growth Rate (SGR), may be given more weight than others. The weights allocated to each metric depends on their relevance in predicting a company’s long-term growth trajectory. Meaning, while scoring a stock, the algorithm gives high weightage to metrics that drive long-term events.
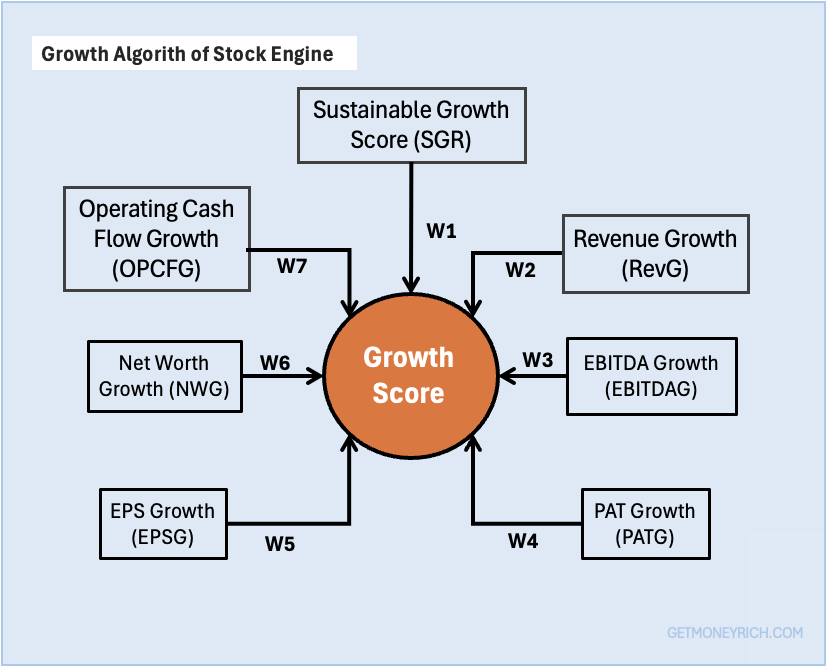
The Calculation: The final Growth Score is calculated using the following formula:
Growth Score = W1*SGR + W2*RevG + W3*EBITDAG + W4*PATG + W5*EPSG + W6*NWG + W7*OPCFGWhere:
- W1, W2, W3, W4, W5, W6, and W7 are the weights assigned to the seven metrics – Sustainable Growth Rate (SGR), Revenue Growth Rate (RevG), EBITDA Growth Rate (EBITDAG), PAT Growth Rate (PATG), EPS Growth Rate (EPSG), Net Worth Growth Rate (NWG), and Operating Cash Flow Growth (OPCFG), respectively.
- SGR, RevG, EBITDAG, PATG, EPSG, NWG, and OPCFG are the individual scores (ranging from 0 to 5) assigned to each metric after the normalization process, as described in the previous section.
After all the individual metrics have been analyzed, normalized, and combined using the weighted average method, the Stock Engine arrives at the final Growth Score. The final score appears on the scale of 0 to 5.
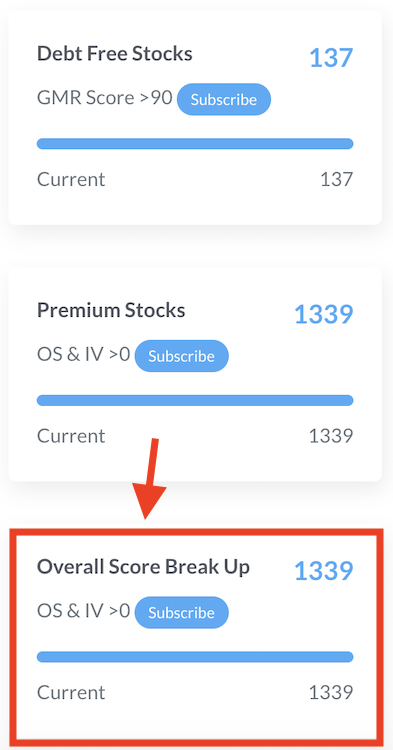
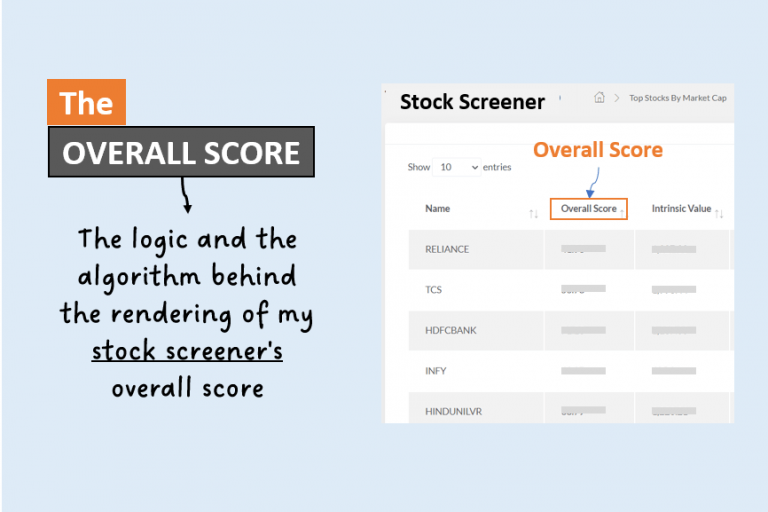
Inside the Stock Engine, there are multiple pre-build screeners. Users can navigate to the “Overall Score Break Up” theme to see a list of all stocks and view their individual “Growth Scores (along with other scores).”
This final score offers a concise and easily understandable way to assess a company’s growth potential.
#4. Why This Algorithm Matters?
So, we’ve gone through the intricacies of the Growth Algorithm.
But the question remains: why should you care about this? What makes this algorithm important and how does it help you?
The primary objective of this algorithm is to help its users get a better perspective of their stock’s growth potential. Idea is to know whether the company is growing sustainably, and not just randomly increasing its topline. Here’s how it helps:
- Identifies Sustainable Growers: Many companies report impressive revenue growth, but these numbers can be misleading. The Growth Algorithm looks beyond topline growth by focusing on multiple aspects of a company’s performance, such as its profitability and cash flow. It helps you identify companies that are growing consistently and sustainably.
- Avoids Hype-Driven Investments: The stock market can often be swayed by hype and popular trends. Many investors get carried away and buy stocks based on rumours, without looking at the fundamentals. This algorithm helps you avoid these pitfalls by focusing on facts and data. By scrutinizing the real underlying performance of companies, the algorithm helps you make decisions based on facts, not just feelings.
- Builds a Robust Portfolio: A successful long-term portfolio is built on companies that have strong fundamentals and show signs of sustainable and continuous growth. This algorithm focuses on companies that not only show revenue growth, but also show consistent growth in profitability, cash flows, and shareholder equity. Such companies are more likely to deliver consistent returns in the long run.
- Offers a Holistic View of Growth: By looking at seven different metrics and using a weighted average approach, this algorithm ensures a complete picture of a company’s growth, not just by one metric or two. The algorithm analyzes many dimensions of a company’s growth and gives a holistic score to each stock.
In short, the Growth Algorithm is designed to take the guesswork out of evaluating a company’s growth potential. It helps you focus on real, consistent growth and avoid the hype-driven investments that often lead to disappointment. It’s a tool designed to empower you, and help you make smarter investment choices.
Summing Up
Why I’m sharing the details of my algorithm?
I keep saying that Stock Engine is different from other stock analysis tool available on the internet because it is not just a reporting tool. What makes it different is its algorithm that can has potential to analyze the numbers behind a company.
By understanding exactly how my algorithm scores its stocks, you get transparency and can trust the Stock Engine. You are not just relying on a “black box,” but can see the logic behind each score. The more you understand, the more comfortable you will be in using the tool.
In this post, I told you about my Stock Engine’s Growth Algorithm. The algorithm keeps evolving. Since 2016, when I first launched the Stock Analysis Worksheet (the Excel sheet version of the Stock Engine), the algorithm has seen at hundreds of revisions. I’m sure, with each revision, its capability has improved.
I built this algorithm with the aim of demystifying the process of stock analysis and empowering, my readers, to make well-informed decisions.
As a retail investor myself, I know how difficult it is to wade through the ocean of information out there and find reliable insights. This algorithm is my attempt to build a system that is based on logic and facts and help my readers navigate this complex world of investments.
If you’re using the Stock Engine, you now have a solid understanding of how the Growth Score is calculated in the background. This transparency should help you trust the ratings and use them effectively in your stock selection process. Remember, the goal is not to find a quick win, but to build a portfolio of long-term winners. This algorithm is a crucial step in this direction.
If you found this article useful, please share it with fellow investors or leave your thoughts in the comments below!
Have a happy investing.


Hi Mani,
Great to see the evolution in your writing. I had originally “stumbled” onto your writing 5-6 years ago and your simple explanations and the various stocks list page was very useful to navigate the Indian stock market with its many “promoters” and investors pumping up stocks for their personal interests.
Keep up the good work !
Thanks. Noted your feedback.