The welding products industry forms the backbone of several key sectors. Performance of construction, manufacturing, and infrastructure sectors drive the welding industry. Welding and cutting equipment are critical for projects requiring durable and precise joining of metals. It makes them indispensable for industries like automotive, shipbuilding, and aerospace. However, this industry’s growth is closely tied to economic cycles. While infrastructure booms fuel demand, slowdowns in capital-intensive sectors can significantly impact revenue of this industry.
One notable advantage of this industry is its essential nature. No large-scale industrial operation can avoid welding and cutting processes. However, the downside is its dependence on raw material costs and technological innovations to stay competitive. This dynamic creates opportunities for well-established players while posing risks for smaller firms. For long-term investors with a horizon of 10-15 years, the sector offers potential. Aligning with India’s growing focus on infrastructure and manufacturing through initiatives like “Make in India”, I think welding products industry has huge growth potential.
Among the leaders in this industry are ESAB India and Ador Welding. In terms of returns, over the past decade (10-Years), ESAB has delivered a 24.89% return, while Ador generated an 18.13% return. It is also worth nothing that in the last 1-Year both these shares performance has been muted. ESAB shares were only flat and Ador shares have corrected by almost -26% in the last 1-Year.
Despite the subdued 1-Year performance, their current valuations, with P/E ratios of 53.48 (ESAB) and 61.62 (Ador) demand a closer look.
Such metrics indicate these companies’ growth stories but also warrant caution for long-term investors evaluating entry points. In this blog post, we look at these two quality companies from this perspective.
1. Business Fundamentals
1.1. Revenue, Profit, Returns
ESAB India has demonstrated strong revenue growth, driven by its leadership in the welding products segment. In FY 2024, the company reported a revenue of Rs.1,249 crore. In the last 5 Years the company’s revenue has grown at a rate of 11.93% per annum. These numbers indicate that there is a consistent growth in sales. This revenue generation is backed by high demand for industrial solutions.
On the other hand, Ador Welding generated Rs.667 crore in revenue for FY 2024. In the last 5 Years the company’s revenue has grown at a rate of 7.35% per annum. As compared to ESAB, Ador reported a relatively lower revenue and growth figures. It is suggesting a smaller market share for Ador.
When it comes to profit and profitability:
- ESAB India recorded a net profit of Rs.163 crore in FY24. In the last 5 Years the company’s PAT & EPS has grown each at a rate of 17.94% per annum. In the same period ESAB saw the ROE and ROCE expansion. ROE increased from 21.14% to 53.25% between 2020 and 2024. Similarly, ROCE increased from 28.34% to 69.55% between 2020 and 2024.
- Ador Welding, meanwhile, posted a net profit of Rs.45.16 crore for FY 2024. In the last 5 Years the company’s PAT & EPS has grown at a rate of 19.66% & 18.71% per annum respectively. In the same period the company’s ROE and ROCE also expanded. ROE increased from 7.51% to 16% between 2020 and 2024. Similarly, ROCE increased from 13.06% to 18.33% between 2020 and 2024.
Although profitable, Ador’s margins are smaller than ESAB’s. These numbers are clearly pointing towards a clear economic moat (competitive advantage) for ESAB.
1.2. Debt Levels
Fast-growing companies often face scrutiny regarding how their growth is financed.
Growth driven by excessive debt can pose long-term risks despite short-term gains. In the case of ESAB India and Ador Welding, their ability to expand earnings and profitability invites a closer look at their dependency on leverage.
- ESAB India has demonstrated impressive financial discipline, operating with virtually no debt over the last five years. Its debt-to-equity (D/E) ratio consistently hovers around zero. It reflects a conservative borrowing strategy. Despite this, the company has achieved stellar 5-year growth in revenue at 11.93% per annum and in PAT and EPS at 17.94% per annum. This debt-free growth underscores ESAB’s operational efficiency and robust internal accruals. It is also supported by industry-leading returns such as a 53.25% ROE and a 69.55% ROCE for FY 2024.
- Ador Welding, while maintaining financial health, has a slightly different profile. Its average D/E ratio over the past five years has been 0.21. It indicates a modest reliance on debt. Despite this, the company has delivered remarkable growth, with a 19.66% annual rise in PAT and 18.71% in EPS over the same period. However, its return metrics, including an ROE of 16.33% and ROCE of 7.01% for FY 2024, suggest that profitability is yet to fully align with its growth ambitions.
The comparison highlights the importance of examining growth quality.
ESAB’s debt-free strategy provides a safety net, while Ador’s manageable but higher reliance on debt demands careful monitoring as it pursues further expansion.
2. Price Valuation
The Price-to-Earnings (P/E) ratio provides insights into how the market values a company’s earnings. A high P/E often signals market confidence in growth prospects. A low P/E can reflect undervaluation or slower growth expectations.
Comparing the P/E trends of ESAB India and Ador Welding reveals stark differences in valuation, growth trajectory, and investor sentiment.
2.1 ESAB India: Consistent and Premium Valuation
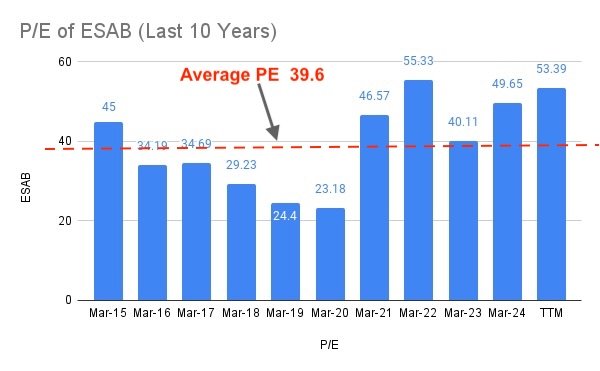
ESAB India has commanded a consistently high PE ratio. Its trailing twelve months (TTM) figure at 53.39.
This premium valuation reflects strong investor confidence in ESAB’s steady earnings growth and superior operational efficiency.
Over the last 10 years, ESAB’s PE has ranged between 23.18 to 55. On an average, the PE of ESAB has been around 39.6 in the last 10 years. From this perspective, today it being at PE of 53.39 looks expensive.
There has been a sharp upward trend in ESAB’s PE post COVID (2020). It may be caused due to that fact that its profitability improved significantly. The company’s PAT and EPS have grown at 5-year compound annual rates of 17.94% and 17.94%, respectively.
I think, high valuations are justified by ESAB’s robust fundamentals, including a stable increase in PAT from Rs.59.29 crore in Mar 2020 to Rs.169.81 crore in TTM 2024.
Despite its premium pricing, ESAB’s consistent ability to deliver earnings growth while maintaining low debt and high returns on equity (ROE of 53.25% in FY24) makes it an attractive long-term prospect for investors seeking stability and growth.
2.2 Ador Welding: Volatility in P/E and Performance
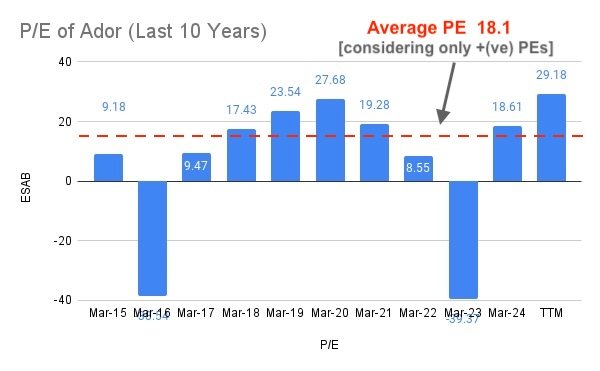
Ador Welding’s PE ratio paints a more volatile picture. Its TTM P/E stands at 29.18, much lower than ESAB.
But its historical P/E values have fluctuated significantly in the last 10-Years. For instance, Ador’s PE dipped into negative territory in Mar 2023 (-39.37) and in Mar 2016 (-38.54) due to a reported loss. However, apart from these two years, the company’s PE history looks reasonable. If leave these two negative years, the 10-Year average PE of Ador would be around 18.1 levels.
In the last 5-years, Ador has reported a PAT and EPS expansion of 19.66% and 18.71% per annum respectively. Even its ROE and ROCE has expanded in the last five years at a rate of 16.33% and 7.01% per annum respectively.
Despite these improvements, Ador’s historical P/E range of 9.18 to 29.18 (excluding negative years). It suggests that the the investors see Ador with a much tempered market outlook compared to ESAB.
This could be due to lower 5-Year average ROE of Ador as compared to ESAB (11.5% vs 36.5%). The ROCE of these two companies are not comparable as ESAB enjoys much better number than Ador’s (48.25% vs 14%).
With ESAB being such a dominant plater of the Welding Industry, I’m sure investors must be viewing Ador (which has a strong business) under the shadow of ESAB. This is the reason why they have valued this company lower due to the concerns about its ability to sustain long-term growth.
Final Thoughts
ESAB India’s high P/E comes from its consistent profitability and market leadership.
Ador Welding’s more modest and fluctuating P/E indicates a company still stabilizing its growth path.
Investors valuing stability and proven performance might lean toward ESAB. While those investors with a higher risk appetite seeking a potential turnaround might consider Ador.
However, ESAB’s higher valuation necessitates careful scrutiny of future earnings growth to ensure it justifies its premium.


Very good article
Thank you Chittaranjan Behera