We all know that investing in the stock market can be exciting. But it can also be quite daunting, especially if you are a newbie investor like I was in year 2008. For a new investor, I know how overwhelming it can be to look at a stock and decide whether it’s a good investment or not. We often get swayed by the stock price, thinking “if the price is going up, it must be a good company.” But that’s not always the case, is it?
What we need is to learn how to look deeper, to understand the actual financial health of a company, rather than just going by the stock price. It’s like going to a doctor for a health check-up. We don’t just look at our weight or blood pressure, but we look at a range of factors to understand our overall health.
Similarly, for a company, we need to look at more than just the stock price.
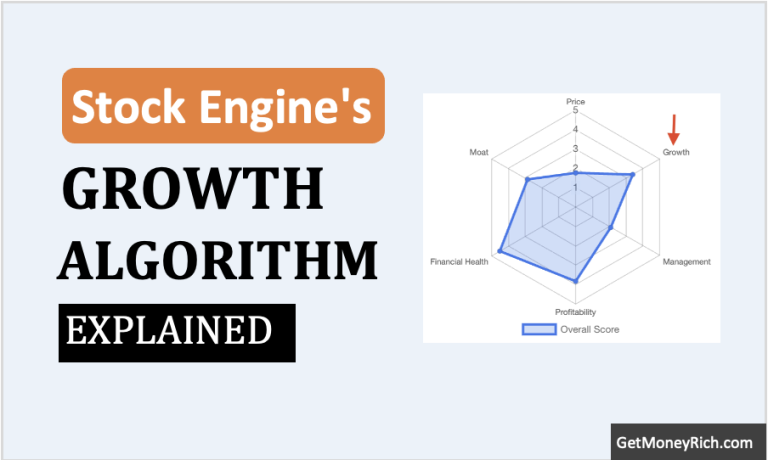
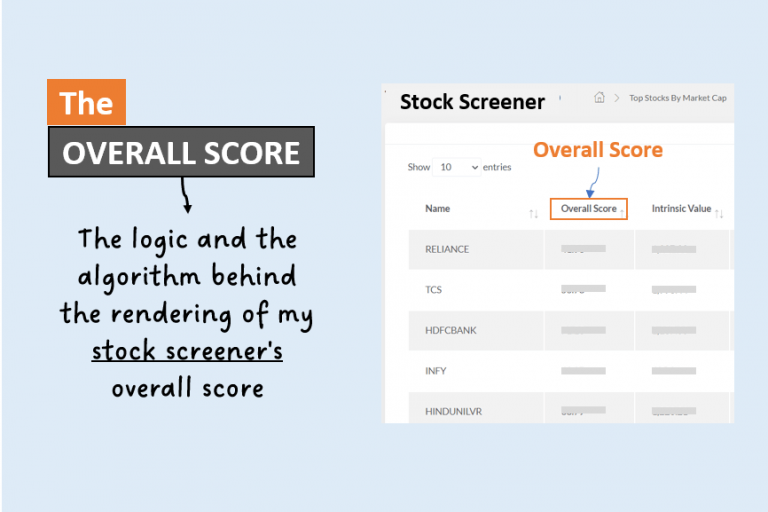
I’ve developed a ‘Stock Engine‘ tool that helps me do just that. The Overall Score algorithm of the tool is used to rate stocks in the scale of 0 to 100. The rating is done based on six parameters, price, growth, quality of management, profitability, financial health, and economic moat.

In this blog post, we’ll look specifically at the financial health algorithm.
It’s an algorithm which analyses the financial health of a company based on several parameters. I won’t get into the exact coding or math of it, but I want to explain the kind of logic that goes behind rating companies based on the financial health metric.
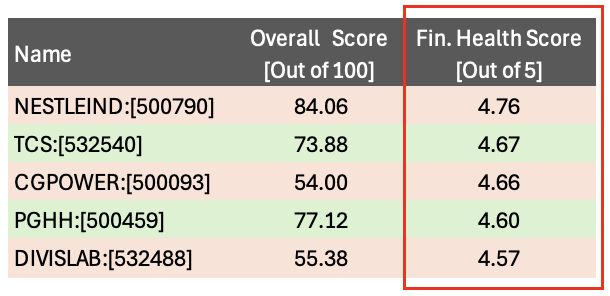
Just to give you a perspective about the financial health algorithm, here are a few top stocks in terms of their financial health score:
So, let’s get into that.
The Core Pillars of Financial Health
When I was creating the financial health algorithm of the ‘Stock Engine’, I wanted to look at four major metrics to do the analysis.
The strength of a company isn’t just about how much money it makes; it’s also about how efficiently it operates, how prudently it manages its debt, and how well it can handle its short-term obligations. That’s why evaluating a company’s financial health requires a combination of metrics that go beyond just looking at the “bottom line.”
- Return on Equity (ROE) and Return on Capital Employed (ROCE) are two such crucial metrics. ROE shows how effectively a company uses shareholders’ investments to generate returns. It reflects management’s ability to create value using the capital invested by shareholders. ROCE, on the other hand, broadens this perspective by revealing how efficiently a company uses all of its capital (both debt and equity). A higher ROCE indicates a better use of total capital and better operational efficiency.
- Debt management is an equally important aspect of financial health. While a Debt-to-Equity (D/E) ratio is a good initial indicator, it doesn’t tell the whole story. We need to consider the company’s cash reserves. That’s why looking at ‘debt minus cash’ gives a clearer picture of the company’s actual debt burden. A company with lower ‘net debt‘ is less exposed to financial risks. A company which is completely debt free or has negative net debt is very strong.
- Liquidity analysis is critical for assessing a company’s immediate financial stability. By using a combination of the current ratio, quick ratio, and cash ratio, we can see if the company has sufficient liquid assets to meet its short-term liabilities. These metrics ensure the company isn’t facing any short term crisis and can easily meet its obligations.
Using ROE, ROCE, a combined approach of D/E ratio and cash on hand to analyze debt, and a combination of liquidity ratios gives us a more comprehensive understanding of the company.
Each of these metrics are important in their own right, but when taken together, they provide a powerful and holistic view of a company’s overall financial health. This is not just about how much a company earns; it’s about how efficiently and securely it operates.
These are four pillars are like the four pillars of a strong building, and a company must be strong in all these four areas.
Let’s discuss more about how the Stock Engine’s algorithm deals with these four metrics.
1. ROE: Digging Deeper
The algorithm doesn’t just look at a single ROE number; instead, it examines ROE over a period of time (5 years).
This range of data is analyzed to understand a company’s consistent performance in generating returns for its shareholders. First, the algorithm gathers data on ROE for the past five years, along with the trailing twelve months (TTM) data. This longer timeframe is crucial to avoid getting misled by a single exceptional year. It allows the algorithm to spot trends and patterns in how effectively a company is using shareholder investments.
The algorithm then calculates the average ROE over this period. To ensure a fair comparison, it normalizes the ROE data if any year shows a zero or negative ROE. This step eliminates the impact of outliers, providing a more accurate assessment of the company’s overall performance.
Next, the algorithm compares the company’s normalized average ROE to the industry average. A company consistently maintaining an ROE higher than its industry peers suggests a stronger ability to generate returns from shareholder capital.
It is a clear sign of a better financial health compared to its competitors.
The algorithm also calculates the range and Standard Deviation of the 5-year+TTM ROE data. This is done to understand how volatile or consistent the ROE has been over the years. Companies with lower standard deviation are considered to have a better and more consistent financial strength.
Finally, the algorithm assigns a score based on three factors:
- (A) ROE vs Industry Average: A higher ROE compared to the industry average gets a better score.
- (B) Absolute ROE number: The absolute number of the ROE is considered, with higher numbers getting a better score.
- (C) ROE Consistency: The consistency of the ROE is considered, with consistent numbers getting a better score.
The final ROE score is determined through a weighted average of these three scores.
This method helps the algorithm determine how good is the company with respect to its ROE, not just for one year, but over the long term.
This detailed approach makes the ROE analysis much more robust than just looking at a single number.
2. Efficiency & ROCE
When assessing a company’s efficiency, Return on Capital Employed (ROCE) is a crucial metric.
Unlike ROE, which focuses on shareholder’s equity, ROCE considers all capital employed by the company, including both debt and equity. It tells us how effectively the company is using all its resources to generate returns, not just the investment by the shareholders.
To analyze ROCE, the algorithm first gathers data for the last five years, along with the trailing twelve months (TTM) data. This extended time frame helps in understanding the company’s efficiency trend over a longer period. This is done to eliminate any random variations in the ROCE from one year to another.
The algorithm then calculates the average ROCE over this period. In case, for any year the ROCE is zero or below, the ROCE for that year is normalized. It is done in order to have a fair comparison among the years.
After this, the algorithm compares the company’s average ROCE to the industry average. If a company consistently maintains a ROCE higher than the industry average, it signals efficient use of capital and good operational performance.
The algorithm also calculates the range and Standard Deviation of 5-year+TTM ROCE data. This helps in understanding how volatile or consistent the ROCE of the company has been over the years.
Finally, the algorithm assigns a score to the ROCE based on these analyses. This score takes into account:
- The ROCE compared to the industry average
- The absolute ROCE number
- The consistency in ROCE.
The final score is determined by a weighted average of these three parameters.
This detailed approach ensures the algorithm doesn’t just consider a single ROCE number but evaluates the overall efficiency of the company in using its capital effectively over the longer run.
This is a good indication of whether the company is able to consistently extract good return from the capital it deploys.
3. Debt Analysis in Deep
The algorithm’s debt analysis goes beyond just looking at the Debt-to-Equity (D/E) ratio.
It takes a more comprehensive approach to determine the company’s debt burden and associated risks.
First, the algorithm gathers data on the company’s total debt and total cash from its balance sheet.
Instead of just considering the total debt, it calculates the ‘net debt‘ by subtracting the total cash from the total debt. This is a very important distinction, as it gives a more accurate picture of the company’s debt situation.
A company with significant cash reserves can offset its debt, making it financially stronger.
If the ‘debt minus cash‘ value is negative, it means the company effectively has more cash than debt, which is a very positive sign.
The algorithm then analyzes the D/E ratio. While not the only metric, it’s still a valuable indicator of how much debt the company is using compared to its equity. A lower D/E ratio generally indicates that a company is not overly reliant on debt.
Based on these calculations, the algorithm then assigns a score that takes into account the following:
- Debt-Free Status: Companies with zero debt (zero D/E ratio) are given the highest score, as they represent the least amount of risk from debt.
- Negative Net Debt: Companies whose ‘debt minus cash’ is negative are given a very good score, as they are not really burdened by debt.
- Low D/E Ratio: Companies with a very low D/E ratio (around 0.3 or so) are given a good score.
- Moderate D/E Ratio: Companies with a D/E ratio below 1 are given a fair score, indicating a moderate amount of debt risk.
- High D/E Ratio: Companies with high D/E ratios are given very low or zero scores, highlighting their higher financial risk due to debt.
This scoring system ensures the algorithm does not just rely on a single metric but provides a complete picture of the company’s debt situation.
By combining ‘net debt’ and D/E ratios, it gives a more nuanced assessment of the company’s financial strength.
4. Liquidity – Can the Company Pay Its Bills?
The algorithm’s liquidity analysis is a multi-faceted approach that goes beyond simply checking if a company has enough cash on hand. It delves into how consistently and effectively a company manages its short-term financial obligations.
It uses three key metrics: the Current Ratio, the Quick Ratio, and the Cash Ratio. Each provides a different perspective on a company’s ability to meet its immediate liabilities.
First, the algorithm gathers data on these three ratios for the past five years for the company. This historical view is crucial as it helps us understand the company’s liquidity trend over time and not just at one point in time.
After gathering the data, the algorithm evaluates the ratios based on five key criteria:
- Consistency (A): The algorithm checks if the ratios (Current, Quick, and Cash) have remained consistent or have improved year-on-year. Consistency in liquidity ratios indicates a stable financial position and reliable management. This means that the company is not just managing its liabilities for a one or two years, but for a long time. The more consistent the numbers, the better the company. A company with consistently high liquidity ratios signals a strong ability to handle its obligations.
- Growth (B): It analyzes the rate of growth of these ratios over the past five years. Growing liquidity ratios signal that a company is becoming financially stronger in the short-term. It also indicates that the company is becoming more capable of handling its day to day financial obligations. Companies that are improving their ability to meet short-term obligations over time get a high score.
- Industry Comparison (C): The algorithm compares the company’s liquidity ratios to the industry average. This step is crucial because what is considered healthy in one industry might not be the case in another. A company with numbers that are better than its industry peers gets a higher score, as this shows that it has a better liquidity position compared to its competitors.
- Absolute Numbers (D): The algorithm also evaluates the absolute values of the current, quick, and cash ratios. High absolute values in these ratios indicate a stronger liquidity position, as it clearly shows the company’s short term asset base and their ability to meet liabilities. It is an indication of the company’s strength in the short term.
- Recent Trends (E): It also assesses the company’s most recent liquidity ratios. This focuses on the current liquidity of the company. It highlights any change in the company’s ability to meet short-term obligations.
After evaluating the company based on the above five factors, the algorithm assigns a score for each parameter.
The final liquidity score is then calculated using a weighted average method.
Weights are assigned to all of the above factors (A, B, C, D, and E) to determine an overall liquidity rating. By considering the consistency, growth, industry comparison, absolute values, and recent trends, the algorithm provides a well-rounded analysis of a company’s liquidity position.
Putting It All Together: A Holistic View
Now, you might be thinking, “Okay, these are a lot of things to consider!” And you’re right. It’s not enough to just look at one or two metrics in isolation. That’s where the magic of my ‘Stock Engine’ comes in. It takes all these factors – ROE, ROCE, debt, and liquidity – and combines them into a single financial health rating.
It’s like going to a doctor and getting a complete check-up. The doctor doesn’t just look at your blood pressure and say you’re healthy. They look at your blood sugar levels, cholesterol, and all other important metrics. Then, based on all these parameters, they give you an overall health score.
Similarly, my ‘Stock Engine’ doesn’t just give a score based on one parameter. It uses a weighted average approach to combine all the individual scores for the above mentioned parameters (ROE, ROCE, Debt, and liquidity) to generate the final score. Some factors are more important than others, so they get more weight. This weighted system helps in giving an accurate picture of the company’s overall financial health.
Conclusion
There is a great power in a well-coded Financial Health Algorithm.
It is important to look beyond just profits and cash to judge a company’s financial health. We must look at profits for sure but through the lens of equity (ROE) and employed capital (ROCE).
We must also take the financial health analysis a step further. It is essential to check how the company manages its debt (D/E ratio and cash position). Its ability to meet its short-term obligations (liquidity ratios) also tells a lot of its financial health.
All of these factors combine to paint a clear picture of how strong a company truly is.
The Stock Engine’s financial health algorithm isn’t just a set of calculations; it’s a carefully coded algorithm designed to capture the nuances of financial health. It’s built to avoid the common mistake of looking at each metric in isolation. Instead, the algorithm brings together various data points in a comprehensive way.
For example, it looks at 5-year historical data, not just the most recent numbers. It normalizes the data to eliminate any outliers and does a comparison with the industry averages.
The algorithm’s power lies in its structured and systematic approach. It doesn’t just perform calculations; it weighs them based on their significance. This weighted average system is coded to ensure that metrics that are more important for determining the financial health are given more emphasis.
It’s designed to avoid a scenario where a single, unusually high number skews the overall rating.
The coding logic is designed to assess a company’s financial position from multiple angles. This is why it considers not just the absolute values of the ratios, but also their consistency, growth, and their relationship with industry averages.
This approach allows the algorithm to adapt to different industries and financial conditions.
For me, the Stock Engine’s health algorithm is more than just code. It’s a system designed to help the users get a near accurate picture of the company’s financial strength. To do it, it analyses the numbers from various angles.
By combining data, logic, and thoughtful design, the algorithm aims to provide a reliable tool to assess a company’s financial health. Remember, investing is a journey of learning, and tools like these are designed to help us along the way.
Happy investing.