Global Literacy Rates Explorer
Compare Countries
| Country ▲ | Continent ▲ | Literacy Rate (%) ▲ | Economic Status ▲ |
|---|
Top 10 Countries With Highest Financial Literacy
| SL | Country/Economy | % Adults Who Are Financially Literate |
|---|---|---|
| 1 | Denmark | 71% |
| 2 | Norway | 71% |
| 3 | Sweden | 71% |
| 4 | Canada | 68% |
| 5 | Israel | 68% |
| 6 | United Kingdom | 67% |
| 7 | Germany | 66% |
| 8 | Netherlands | 66% |
| 9 | Australia | 64% |
| 10 | Finland | 63% |
Table of Contents
- 1. What is Financial Literacy and Why It is Important?
- 2. Why Financial Ignorance Must Be Avoided
- 3. Financial Literacy Survey
- 4. What Question Were Asked In the Financial Literacy Survey?
- 5. Inference of the Survey
- – 5.1 Countries With Highest Financial Literacy
- – 5.2 Financial Literacy in Europe
- 6. GDP Per Capita And Financial Literacy
- 7. The Understanding of The Financial Concepts
- 8. Financial Literacy Among Women and Poor
- 9. Financial Literacy And Age
- 10. Financial Literacy And Income
- 11. Financial Literacy & Education
- 12. Financial Literacy & Home Ownership
1. What is Financial Literacy and Why It is Important?
People with better understandig of the basic financial concepts can be said to be financially literate.
Financial literacy gives one the ability to make better decisions on money related things like saving, investing, borrowing, etc.
In today’s world why financial literacy has become critical for people? It is because complex financial products like bonds, stocks, mutual funds, REITs, ETFs, etc have become very accessible to common people. Now, almost anyone with a smart phone, a bank account, and a trading account can access these products.
Moreover, the governments across the world also wants people to use more financial services, and this is done with a broader goal of financial inclusion in mind. As a result, more and more people these days have bank accounts and use credit related products (like loans, credit cards, etc).
Hence, it is only logical to expect that people who use these products should have the skill to understand and use these financial services wisely.
There is another crucial reason.
Almost all governments want their people to take control of their own retirement, i.e. to have financial security after they retire from their job or business. Government and employers do not want to keep the burden of supporting people after retirement.
For that, such pension related products are designed where the decision making is more in the hands of the people. Hence, people must be financially literate to handle such retirement related financial products.
People who are financially savvy become better investors of money. They tend to pick their investments wisely and they also spread their money in a way that it diversifies their risk of loss.
2. Why Financial Ignorance Must Be Avoided
There are huge costs associated with financial ignorance.
For example, people who do not understand the concept of compounding returns (interest) tend to be more debt dependent and lead a riskier life. As a result their credit ratings become bad and they have to pay more interest on their loans.
It creates a vicious cycle which can trap them under debt for a longer time horizons. These are the same people who save less money from their income.
Ideally, we want to live in a nation where people are less debt dependent and are saving and investing as a way of life. This goal can only be achieved if only a small percentage of our population are financially ignorant.
3. About Financial Literacy Survey of S&P
3.1 Survey Basics
There was this survey conducted by S&P called “S&P Global FinLit Survey” across the countries of the world. In this survey, they collected data on financial literacy.
In the year 2014 more than 1.5 Lakhs people were interviewed to judge their financial literacy levels. The people (randomly selected adults) were representatives of more than 140 countries.
To judge and measure the financial literacy of these people face-to-face questions were asked to them by the research team. These questions were carefully picked to access the basic financial knowledge of the people.
The questions were related to four fundamental concepts which assists people in financial decision making.
- Knowledge of Interest Rates
- Understand of interest compounding
- Awareness about inflation, and
- Understanding of the concept of risk diversification.
“Based on this survey, it was found that on an average, only 33.33% (one third) adults are financially literate, globally.”
What does it mean? As the survey says and I quote, “Not only financial “illiteracy” widespread, but there are big variations among countries and groups.”
3.2 Who Were More Financially Literate
What are the variations? For example, women, the poor, and lower educated people are less financially aware, or we can say they tend to be more illiterate.
This trend is common for developed and developing economies. These three sets of people tend to be more financially illiterate across the globe
3.3 Effect of Bank Account & Credit
This trend was also common.
People who had bank accounts and were using some credit instruments like loan or credit cards were financially more literate.
It is possible that because of their exposure to these products, they have built this understanding. No matter whatever was their income level, people using these two financial products were financially more sound.
Even poor people, who has bank accounts were financially more literate. Bank accounts give these people the access to credit. This exposure gave them financial literacy as compared to poor people who had no bank accounts.
In this survey, this understanding was clear that use of credit gave people more financial awareness. Rich or poor people who use credit (loan, credit cards, etc) have much better financial literacy.
This survey also points at two important general observations:
- First, growing financially literacy will lead to faster financial inclusion.
- Second, when people start using financial products like bank accounts or credit cards, their financial skills begins to grow.
3.4 Use of The Survey
It gives us an idea about the spread of financial literacy across the globe. This survey points in the direction where financial literacy is high and where it is lacking.
As a financial blogger, this kind of data set is useful for me to tune my contents in a direction where it is more needed.
4. What Question Were Asked In the Financial Literacy Survey?
Four Types of Questions were asked in the survey:
| Concept: Risk Diversification Q1: Suppose you have some money. Is it safer to put your money into one business or investment, or to put your money into multiple business or investments? Answers: One Business or InvestmentsMultiple Businesses or InvestmentsDon’t KnowRefused to answer | Concept: Inflation Q2: Suppose over the next 10 years the prices of things you buy double. If you income also doubles, will you be able to buy less than you can buy today, the same you can buy today, or more than you can buy today? Answers: LessThe SameDon’t KnowRefused to answer |
| Concept: Interest Rate Q3: Suppose you need to borrow 100 US dollars. Which is the lower amount to pay back: 105 US dollars, or 100 US dollars plus three percent? Answers: 105 US dollar100 USD plus 3 percentDon’t KnowRefused to answer | Concept: Compound Interest Q4: Suppose you put money in the bank for two years and the bank agrees to add 15% per year to your account. Will the bank add more money to your account the second year than it did the first year, or will it add the same amount of money both years? Answers: MoreThe SameDon’t KnowRefused to answer |
| Concept: Compound Interest Q5: Suppose you had 100 US dollars in a savings account and the bank adds 10% per year to the account. How much money would you have in the account after five years if you did not remove any money from the account? Answers: More than 150 dollarsExactly 150 dollarsLess than 150 dollarsDon’t KnowRefused to answer |
In the survey, the rule was that, a person will be categorized as financially literate if he or she can answer the questions on at least three concepts as stated above.
The survey clarifies that this criteria to judge the financial literacy level of people is fair. The five questions are so framed that they include the basic concept necessary to take sound financial decisions for oneself and the family. Out of the four concepts, if people can comprehend at least three, they are good to go in life.
I personally think that, understanding of the concept #4 (Compound Interest) will make a big difference in persons wealth building ability. It is a very useful skill to learn early in life.
5. Inference of the Survey
As per this criteria and the scope of the survey, only about 33.33% of people in the world can be called as financially literate.
What does this data translate into?
The total population of our world is about 8 billion. Out of these about 75% people are above the age of 15 (adults). It means, there are about 6 billion adult people in this world. Among these 6 billion people, only about 2 billion (33.33%) are financially literate.
We must also note that, in the developing economies, the percentage adults who are financially literate are much lower. Like, India has only 24% financially literate adults. It means, that initiatives to enhance the financial literace in India is a must.
5.1 Countries With Highest Financial Literacy
There are only 8 countries whose financial literacy percentage (as per the S&P survey) was higher than 65%. These were Denmark, Norway, Sweden, Canada, Israel, UK, Germany, and Netherlands.
United States is among the top 15 countries with about 57% adults as financially literate.
Down Under, Australia and New Zealand have the most financially literate adults with survey giving them 64% and 61% literacy numbers.
Now, I’ll share with you an observation that have surprised me the most:
- Bhutan (54%), Myanmar (52%): These two countries are among the top 20 list of countries with more than half of their adults being financially literate. Both these countries are India’s neighbour and are considered too small. Bhutan in many way is a part of India, but see, how well they have done in terms of financial literacy. Myanmar is also a country where the only news we hear about it is civil war. But I think, inside, the reality is better for their own people.
- African Countries: Most of the African countries, with whom India may not like to compare, are financially much more literate than. Botswana at 52% is among the top 25 countries. South Africa (42%) and Zimbabwe (41%) have financial literacy much higher than the world’s average.
- India, China, Pakistan: Among these countries, who do you think has a higher financial literacy percentage? China is 28%, Pakistan is 26%, and India is only 24%. Yes, Pakistan is higher than us.
5.2 Financial Literacy in Europe
Where the world average is 33.33%, financial literacy percentage of Europe is about 52%.
Withing the Europe itself, there is large disparity between economies.
- Norther Europe (65%) tends to have much better financial literacy. Countries like Finland, Sweden, Norway, Denmark, United Kingdom, Germany, Netherlands have the highest financial literacy in the world. On an average, more than 65% of adults in this region are financially literate.
- Rest of Europe (26% to 55%): is not as good as northers Europe. In countries like Greece and Spain, their financial literacy is 45% and 49% respectively. I was expecting France to be in the Ligue of Germany, but it has a literacy number of 52%. Italy is much lower at 37% which is lower than Poland’s 42% but higher than Portugal’s 26%. The countries that surprised me were Estonia with 54% and Latvia with 48% financial literacy numbers. Ireland was also very good at 55% levels.
- Countries That Joined EU in or After 2004 (22 to 35%): Most of these countries have a comparatively lower financial literacy levels. For example, Bulgaria and Cyprus’s has only 35% adults as financially literate. In Romania, only 22% was literate.
6. GDP Per Capita And Financial Literacy
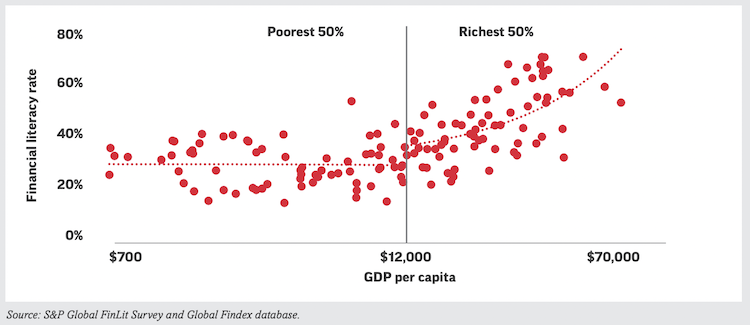
There is also a relationship between GDP per capita and financial literacy rates across countries.
- Financial literacy rates tend to be higher in richer countries, as measured by GDP per capita.
- This relationship holds true primarily for the richest 50% of economies (with GDP per capita of more than $12,000), there is an increase in financial literacy with increasing income.
- For the poorer half of economies (with a GDP per capita of $12,000 or less), there is no clear association between income and financial literacy.
- The report suggests that in poorer economies, government policies relaed to education etc are likely play a more significant role in shaping financial literacy than income of people.
7. The Understanding of The Financial Concepts
- Globally, inflation and numeracy (interest rate calculations) are the most understood concepts, with 50% of adults worldwide answering these correctly.
- Risk diversification is the least understood concept globally, with only 35% of adults answering correctly.
- There are significant disparities in understanding risk diversification between major advanced economies (64% correct) and major emerging economies (28% correct), a difference of 36 percentage points.
- Disparities for the other concepts are smaller: a 15-percentage-point difference for inflation and a 10-percentage-point difference for compound interest between major advanced and emerging economies.
8. Financial Literacy Among Women and Poor
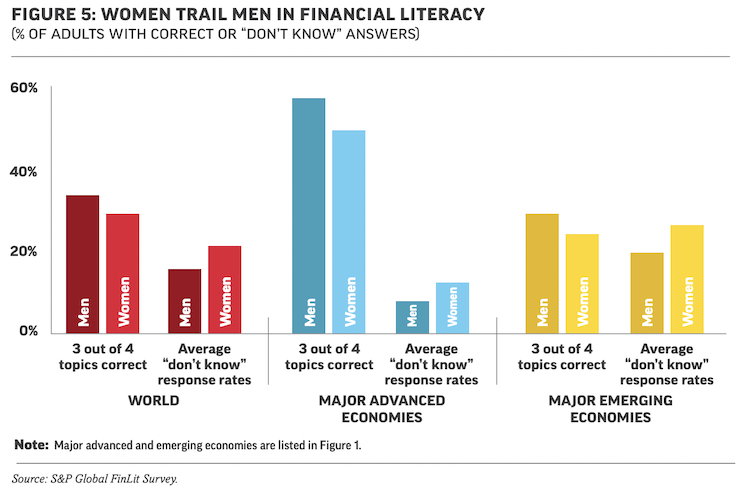
The survey highlights a clear gap in financial literacy between men and women.
Globally, 35% of men are financially literate, while only 30% of women achieve the same level.
This 5-percentage-point difference is consistent across both advanced and emerging economies, showing that women often struggle more with financial concepts.
There is something interesting that the survey has pointed our. Women are more likely to say “I don’t know” when asked financial literacy questions, a trend seen in other studies too.
This gender gap doesn’t change much even when you account for factors like age, education, or income. In emerging economies, the gap remains at 5 percentage points, though it disappears in places like China and South Africa, where both men and women have equally low financial literacy.
Figure 5 (see above) of the survey report shows this clearly, men consistently score higher on answering 3 out of 4 financial topics correctly, while women have higher “don’t know” response rates, especially in advanced economies.
9. Age and Financial Literacy

The Survey shows how financial literacy varies by age across different economies.
Globally, the data reveals a pattern where financial literacy tends to peak in middle age.
- For the world as a whole, adults aged 36–50 have a literacy rate of around 35%.
- Both the youngest (15–35) and oldest (65+) groups hover around 30%.
- The above two data sets indicate that middle-aged adults are generally more financially knowledgeable.
In major advanced economies like the United States and Germany, the trend is slightly different.
- Here, 56% of young adults (ages 15–35) are financially literate.
- It rises to 63% for those aged 36–50.
- However, literacy drops for older adults, with only about 40% of those over 65 being financially literate.
- These data sets suggests that in richer countries, almost everyone is better placed in terms of financial literacy as per global averages.
In major emerging economies like India and Brazil, the picture flips.
- Young adults aged 15–35 have the highest financial literacy at 32%.
- The oldest group (65+) has the lowest at just 17%.
- This gap shows that younger people in these economies are more financially aware, likely due to better access to education and technology. Older adults may lack the resources or opportunities to learn, highlighting a need for targeted financial education for seniors.
10. Income & Financial Literacy
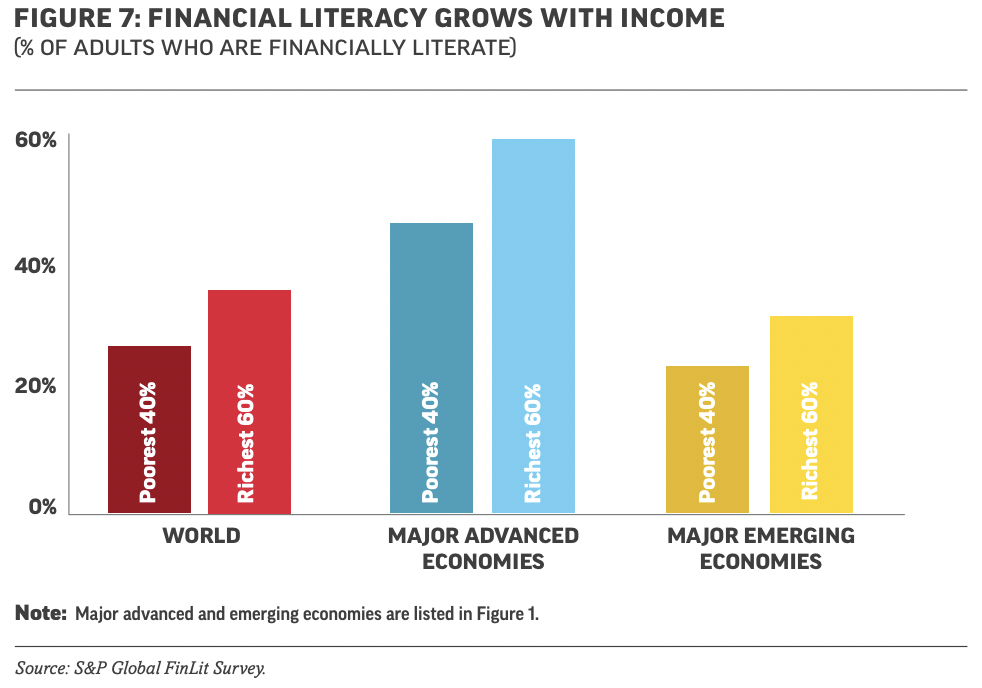
The survey reveals a clear link between income and financial literacy.
Globally, richer adults tend to have better financial skills than poorer ones.
In major emerging economies like India and Brazil:
- 31% of adults in the richest 60% of households are financially literate.
- Only 23% of those in the poorest 40% reach this level, showing an 8-percentage-point gap.
- This difference highlights how access to resources and education, often tied to income, impacts financial knowledge.
In major advanced economies such as the United States and Germany, the income gap in financial literacy is similar but can be even wider in some cases.
- For instance, in Italy, 44% of adults in the richest 60% of households are financially literate, compared to just 27% in the poorest 40%, a stark 17-percentage-point difference.
- This suggests that wealthier individuals in advanced economies benefit from greater exposure to financial systems and education, widening the literacy gap.
Figure 7 of the survey report confirms this trend across the world, major advanced economies, and major emerging economies.
The consistent gap underscores the need for targeted financial education programs for lower-income groups. Without addressing this divide, poorer households may struggle more with financial decisions, potentially deepening economic inequality.
11. Education & Financial Literacy
The survey shows a strong connection between education and financial literacy.
Globally, there’s a 15-percentage-point gap between adults with different education levels.
- In major advanced economies like the U.S. and Germany, 52% of adults with secondary education (9–15 years of schooling) are financially literate.
- But this value drops to 31% for those with only primary education (up to 8 years).
- For those with tertiary education (15+ years), the rate jumps to 73%.
- These numbers highlight how more education, especially in math, helps people understand financial concepts better.
The report also links math skills to financial literacy. The survey has used the 2012 OECD PISA math test scores for 15-year-olds. Countries where students scored higher in math tend to have higher financial literacy rates.
- As PISA math scores rise from 350 to 650, financial literacy rates increase from around 20% to 60%.
This suggests that a strong foundation in math, often gained through education, equips people to handle financial decisions like budgeting or investing more effectively.
However, there are outliers like South Korea, China, Portugal, and Vietnam, where high math scores don’t fully translate into financial literacy.
- In South Korea, 48% of adults aged 35 or younger are financially literate, compared to 27% of those aged 51–65, despite strong math skills among the youth.
- In Portugal, the gap is similar, with 38% of younger adults versus 20% of older ones.
- This indicates that while math skills help, other factors like access to financial education or real-world experience also play a big role in building financial literacy.
12. Financial Literacy & Home Ownership
The survey shows that homeowners in major advanced economies generally have better financial skills.
- About 26% of adults in these countries, like the U.S. and Japan, have a housing loan.
- Since managing a mortgage involves complex calculations, they tend to be more financially literate than the average person.
However, there are still gaps in financial knowledge among homeowners.
- In the United States, nearly a third of adults have a housing loan.
- While 70% of them can correctly answer questions about compound interest, 30% cannot.
- This is worrying because misunderstanding interest can lead to debt problems, a factor that contributed to the global financial crisis through mortgage defaults. Read more about the US mortgage crisis of 2008-09.
- It shows that even homeowners, who are expected to be financially savvy, can struggle with basic concepts.
The issue isn’t limited to the U.S.
In Japan, about 20% of adults have a housing loan. But only half are financially literate, and just 37% understand compound interest. This gap highlights a broader concern that many homeowners in advanced economies lack the skills to fully manage their loans.
Policymakers need to focus on improving financial education for homeowners to prevent future financial troubles.
Table: Financial Literacy (% Adults Who Are Financially Literate) by Country
| SL | Country/Economy | % Adults Who Are Financially Literate |
| 1 | Denmark | 71% |
| 2 | Norway | 71% |
| 3 | Sweden | 71% |
| 4 | Canada | 68% |
| 5 | Israel | 68% |
| 6 | United Kingdom | 67% |
| 7 | Germany | 66% |
| 8 | Netherlands | 66% |
| 9 | Australia | 64% |
| 10 | Finland | 63% |
| 11 | New Zealand | 61% |
| 12 | Singapore | 59% |
| 13 | Czech Republic | 58% |
| 14 | Switzerland | 57% |
| 15 | United States | 57% |
| 16 | Belgium | 55% |
| 17 | Ireland | 55% |
| 18 | Bhutan | 54% |
| 19 | Estonia | 54% |
| 20 | Hungary | 54% |
| 21 | Austria | 53% |
| 22 | Luxembourg | 53% |
| 23 | Botswana | 52% |
| 24 | France | 52% |
| 25 | Myanmar | 52% |
| 26 | Spain | 49% |
| 27 | Latvia | 48% |
| 28 | Montenegro | 48% |
| 29 | Slovak Republic | 48% |
| 30 | Greece | 45% |
| 31 | Tunisia | 45% |
| 32 | Uruguay | 45% |
| 33 | Croatia | 44% |
| 34 | Kuwait | 44% |
| 35 | Lebanon | 44% |
| 36 | Malta | 44% |
| 37 | Slovenia | 44% |
| 38 | Hong Kong SAR, China | 43% |
| 39 | Japan | 43% |
| 40 | Poland | 42% |
| 41 | South Africa | 42% |
| 42 | Chile | 41% |
| 43 | Mongolia | 41% |
| 44 | Turkmenistan | 41% |
| 45 | Zimbabwe | 41% |
| 46 | Bahrain | 40% |
| 47 | Kazakhstan | 40% |
| 48 | Senegal | 40% |
| 49 | Tanzania | 40% |
| 50 | Ukraine | 40% |
| 51 | Zambia | 40% |
| 52 | Lithuania | 39% |
| 53 | Mauritius | 39% |
| 54 | Belarus | 38% |
| 55 | Cameroon | 38% |
| 56 | Kenya | 38% |
| 57 | Madagascar | 38% |
| 58 | Russian Federation | 38% |
| 59 | Serbia | 38% |
| 60 | Togo | 38% |
| 61 | United Arab Emirates | 38% |
| 62 | Benin | 37% |
| 63 | Italy | 37% |
| 64 | Taiwan, China | 37% |
| 65 | Azerbaijan | 36% |
| 66 | Malaysia | 36% |
| 67 | Brazil | 35% |
| 68 | Bulgaria | 35% |
| 69 | Costa Rica | 35% |
| 70 | Cyprus | 35% |
| 71 | Côte d’Ivoire | 35% |
| 72 | Dominican Republic | 35% |
| 73 | Gabon | 35% |
| 74 | Malawi | 35% |
| 75 | Sri Lanka | 35% |
| 76 | Uganda | 34% |
| 77 | Algeria | 33% |
| 78 | Belize | 33% |
| 79 | Burkina Faso | 33% |
| 80 | Jamaica | 33% |
| 81 | Korea, Rep. | 33% |
| 82 | Mali | 33% |
| 83 | Mauritania | 33% |
| 84 | Colombia | 32% |
| 85 | Congo, Dem. Rep. | 32% |
| 86 | Ethiopia | 32% |
| 87 | Ghana | 32% |
| 88 | Indonesia | 32% |
| 89 | Mexico | 32% |
| 90 | Puerto Rico | 32% |
| 91 | Congo, Rep. | 31% |
| 92 | Niger | 31% |
| 93 | Saudi Arabia | 31% |
| 94 | Ecuador | 30% |
| 95 | Georgia | 30% |
| 96 | Guinea | 30% |
| 97 | Argentina | 28% |
| 98 | China | 28% |
| 99 | Peru | 28% |
| 100 | Bosnia and Herzegovina | 27% |
| 101 | Egypt, Arab Rep. | 27% |
| 102 | Iraq | 27% |
| 103 | Moldova | 27% |
| 104 | Namibia | 27% |
| 105 | Panama | 27% |
| 106 | Thailand | 27% |
| 107 | Chad | 26% |
| 108 | Guatemala | 26% |
| 109 | Nigeria | 26% |
| 110 | Pakistan | 26% |
| 111 | Portugal | 26% |
| 112 | Rwanda | 26% |
| 113 | Philippines | 25% |
| 114 | Venezuela, RB | 25% |
| 115 | West Bank and Gaza | 25% |
| 116 | Bolivia | 24% |
| 117 | Burundi | 24% |
| 118 | India | 24% |
| 119 | Jordan | 24% |
| 120 | Turkey | 24% |
| 121 | Vietnam | 24% |
| 122 | Honduras | 23% |
| 123 | Romania | 22% |
| 124 | El Salvador | 21% |
| 125 | Macedonia, FYR | 21% |
| 126 | Sierra Leone | 21% |
| 127 | Sudan | 21% |
| 128 | Uzbekistan | 21% |
| 129 | Iran, Islamic Rep. | 20% |
| 130 | Kosovo | 20% |
| 131 | Nicaragua | 20% |
| 132 | Bangladesh | 19% |
| 133 | Kyrgyz Republic | 19% |
| 134 | Armenia | 18% |
| 135 | Cambodia | 18% |
| 136 | Haiti | 18% |
| 137 | Nepal | 18% |
| 138 | Tajikistan | 17% |
| 139 | Angola | 15% |
| 140 | Somalia | 15% |
| 141 | Afghanistan | 14% |
| 142 | Albania | 14% |
| 143 | Yemen, Rep. | 13% |
| A | South Asian Countries (General) | 0–24% (as per page 8, “South Asia… only a quarter or fewer”) |
| B | Southern Europe (General) | 25–54% (as per page 8, e.g., Greece 45%, Spain 49%) |
| C | EU Countries (Joined since 2004, General) | 22–58% (as per page 8, e.g., Romania 22%, Czech Republic 58%) |
Access Financial Literacy Data of almost all countries of the world
Source: SP& Global FinLit Survey