The UPL Limited has been in my stock portfolio for some time. At the current valuations, the company is valued at Rs.45,000 crores as its market capitalization. In the last 10 years, this stock has yielded a price appreciation of about 20% per annum. Now, I’m trying to reevaluate my holdings in this company.
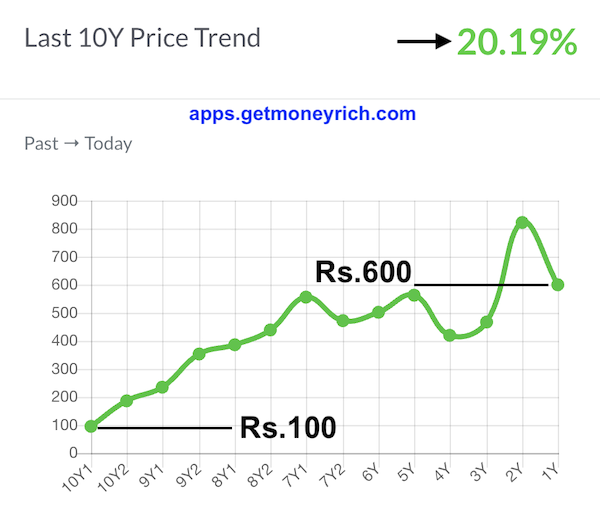
The last 10-year price data of UPL Limited shows a decent picture. But in the last 5 years, the stock has remained mostly flat. The CAGR (growth) of the stock price has been a dismal 6.6%. For an equity investor, this is not acceptable. Five years of holding time is a decent long-term, and a below-average return of 6.6% is bad. Even Nifty 50 has given an 11% CAGR return in the last 5 years.
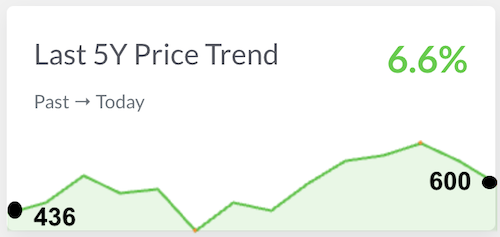
So, for long-term investors like me, it is time to reevaluate our holdings in this stock. In normal circumstances, I would have sold this stock feeling happy that the stock did its job in my last 10 years of holding (20% CAGR).
But in the last sixteen months or so, there has been a tremendous correction in this stock. The stock price has fallen from Rs.820 to Rs. 600 levels (-28%). In the last 1 year, the price has gone down by more than 20%.

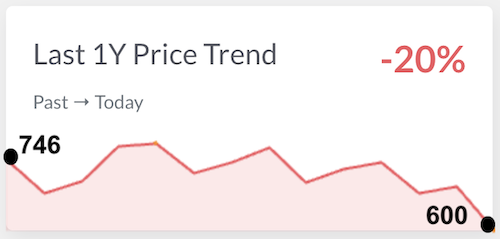
So, I’m evaluating whether should I consider selling my holding or buy more of it. Whenever I face this kind of dilemma, it is an indicator that I should do a thorough fundamental analysis of my stock.
When I say fundamental analysis, doing the analysis of a stock using the DCF Method is what I mean.
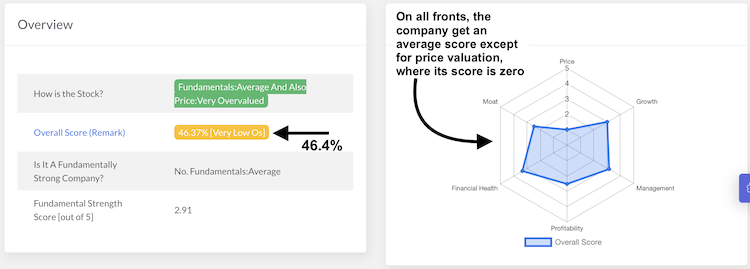
I would just like to bring it to your attention that my Stock Engine has given UPL Ltd an Overall Score of 46.4% which is too low.
#1. Intrinsic Value Estimation
I estimate the intrinsic value of my stocks mostly using the DCF Method for which we need free cash flows.
There are two ways to calculate the free cash flows of the company. The first and the primary one is taking numbers from the cash flow report. The second method is where the numbers are collected from the profit and loss accounts of the company. Learn to read financial statements of companies.
For such stocks that have remained flat for extended periods (like 5 years), I’ll rely only on the numbers from the cash flow report. It is a stringent method but for flattish stocks like UPL Limited, it is what is necessary.
The idea is to check, what has caused the stock to remain flattish for the last five years. The analysis will also unearth if I should add more to my holdings in this stock or rather sell it.
The analysis should start with free cash flow calculations.
#1.1 Free Cash Flow To Firm (FCFF)
To calculate free cash flow to the firm (FCFF), we’ve two alternatives. But for UPL we’ll rely only on the values from its cash flow report. Why? Because I want my conclusion to be close to reality. I’ve more confidence on the numbers of the cash flow report.
We need the following values to estimate its FCFF:
- Net Cash Flow From Operating Activities.
- Capex.
| Description | 2023 | 2022 |
| PAT | 4,414 | 4,437 |
| Net cash flow from operating activities | 7,751 | 6496 |
| CAPEX | -1,672 | -2,022 |
| FCFF | 6,079 | 4,474 |
The free cash flow to the firm comes out to Rs. 6079 and Rs. 4474 crores in the last two years. During these two FYs, the company has reported a net profit of Rs.4,414 and 4,437 crores respectively.
Net cash flow from operating activities is actually higher than the PAT. It is a big positive.
But before we can finally conclude if the free cash flow is healthy for its investors or not, we must calculate the free cash flow to equity (FCFE).
Please Note: We can also use another formula to calculate the FCFF. This formula is FCFF = PAT + D&A – Capex – Increase in Working Capital. Using this formula as well, the FCFF of UPL Limited comes out to be Rs.4,042 Crore in the FY 2022-23. To know how to calculate FCF, check this article.
#1.2 Free Cash Flow To Equity (FCFE)
FCFF and FCFE are both measures of a company’s free cash flow. However, there are some key differences between the two.
- FCFF: FCFF is the cash flow available to all types of investors. Here, both shareholders and debt providers to the company are referred to as investors.
- FCFE: FCFE is the cash flow available only to shareholders.
When we are doing DCF analysis, we are mainly doing it as an existing or prospective shareholder of the company. Hence, for us, FCFE is the required metric. To know more about FCFF and FCFF, read this article on free cash flow.
To calculate FCFE, we’ll need the following numbers:
- Free Cash Flow To Firm (FCFF).
- Net New Debt (= Net Debt taken – Debt Repaid).
- Interest Paid (Finance Cost).
- Effective Tax Rate.
| Description | 2023 | 2022 |
| FCFF | 6,079 | 4,474 |
| Net New Debt | -4,595 | 1,306 |
| Interest | 2,345 | 1,941 |
| Tax Rate | 14.74% | 10.65% |
| FCFE | -515 | 4,046 |
You can see that, in FY 2022-23, the Free Cash Flow (FCFE) for the company comes out as negative.
The main reason why the FCFE is negative is that the company has used the majority of its FCFF to pay back the loan’s principal and interest.
In a way, it is good that the company is using its cash flows to get rid of its loan burden. But the immediate effect of these loan paybacks is causing its FCFE (free cash flow) to go into negative.
To understand why the debt is draining so much of the company’s cash flows, we must also look at its capital structure.
#1.3 Debt Analysis is Necessary
Negative free cash flow to equity is like negative net profit. To the owners (shareholders) of the company, Free Cash Flow To Equity (FCFE) is the real profit. A positive PAT or FCFF is not as relevant.
So, for UPL Limited, we’ve seen that though the company has posted good PAT and FCFF numbers, its FCFE is still negative in FY 2022-23. The reason for this negative reporting was debt repayment, both principal and interest.
To understand why so much cash is flowing out to manage debt, let’s look at the company’s capital structure and its debt-to-equity ratio.
| Description | Mar-23 | Mar-22 | Mar-21 | Mar-20 | Mar-19 |
| Net Worth | 26,858.00 | 21,675.00 | 17,901.00 | 16,296.00 | 14,715.00 |
| ST Borrowings | 2,855.00 | 4,261.00 | 1,414.00 | 1,298.00 | 2,478.00 |
| LT Borrowings | 20,144.00 | 21,605.00 | 22,146.00 | 27,371.00 | 26,383.00 |
| Total Debt | 22,999.00 | 25,866.00 | 23,560.00 | 28,669.00 | 28,861.00 |
| Total Capital | 49,857.00 | 47,541.00 | 41,461.00 | 44,965.00 | 43,576.00 |
| Debt To Equity | 0.86 | 1.19 | 1.32 | 1.76 | 1.96 |
| Debt as % of Total Capital | 46.13% | 54.41% | 56.82% | 63.76% | 66.23% |
Out of the total capital of the company, nearly 50% is financed from debt. In the FY ending March ’19, the debt dependency was as high as 66.23%. The debt-to-equity ratio in the same year was 1.96, which is too high.
Though the company has tried to reduce its debt dependency in the last 5 years, its debt levels are still too high.
The result of this high debt is that the company is yielding negative free cash flow to equity (FCFE) which is detrimental to the shareholders.
Conclusion
If we look only at the company’s last 10 years reported numbers, the performance of UPL Limited is very good. From these numbers, it looks like that company is poised to grow at the rate of about 15% per annum.
| Description | FY 2023 | FY 2014 | Growth |
| Revenue (Rs.Cr.) | 54,053 | 10,902 | 17.36% |
| EBITDA (Rs.Cr.) | 10,503 | 2,057 | 17.71% |
| PAT (Rs.Cr.) | 4,257 | 942.10 | 16.28% |
| Reserves (Rs.Cr.) | 26,708 | 5,162 | 17.87% |
| Total Assets (Rs.Cr.) | 88,577 | 12,858 | 21.29% |
| Net Cash From Operations (Rs.Cr.) | 7,751 | 1,442.11 | 18.31% |
| Projected Future Growth | – | – | 15% p.a. |
Some people might get carried away with these numbers and invest in UPL.
But when we drill into its free cash flows, we will see that there is no cash available for the shareholders (FCFE). The reason for this lack of cash is that most of its cash is being used to pay back the loan.
When the FCFE of a company is negative, its intrinsic value becomes zero. Hence, at all price levels, it will look expensive.
Final View
But does the negative FCFE make UPL non-investible? Not. Why? Because seeing the other fundamentals of the company, negative FCFE looks like a temporary phenomenon. The kind of market share the company has, cannot be ignored. Such stocks must be bought at a higher margin of safety.
Suppose, in the next two years, the company manages to convert its FCFE into positive. Currently, its FCFF is about Rs.6,000 Crore. Let’s say, it can convert about 10% of its FCFF into FCFE (Rs.600 Crore). Assuming a slow normal period growth rate of 12% and nominal growth rate of 3%, at a 12% discount rate, the intrinsic value of UPL comes out to be Rs.560 per share.
At the current price level of Rs.600, it is trading at a PE multiple of 16.5. If the stock’s price corrects by another 10% to 15% from these levels, I may consider reinvesting in it.
For the moment, I’m neither selling nor buying. I’ll say, between Rs.500 and Rs.525, for me, this stock is a decent long-term buy (holding period 10 years).
Have a happy investing.
Suggested Reading:


