Before we can do a leverage analysis of a company, we must know the basic definition of “leverage.” What is leverage?
There can be two sources of capital for a company. First, equity and second is borrowed money (loan/debt). When a company uses loans to fund its capital requirements, we can say it is leveraged.
What does the company do with leverage? The company uses the borrowed money to expand its asset base. The bigger asset-based enhances the “installed capacity” of the company. Bigger capacity renders more sales and profits.
More profits result in an improvement in the shareholder’s value. For example, higher profits results in higher Return on Equity – ROE (= PAT / Equity).
First – Few Basic Understanding of Business

Before going into the details of leverage analysis, let’s talk about the basic concept of doing business. This will help in understanding why we are doing this analysis in the first place.
Operating Fixed Cost
Companies have a cost of doing business. Operating Fixed Cost is one type of cost. Depending on the type of business, and its installed capacity, each company will have a typical ‘operating fixed cost.’ Unfortunately, companies have little control over this cost.
Even when the company is not in operation, it will incur some costs. This type of “fixed-overheads” is called “operating fixed costs”. Few examples of such costs are salaries, depreciation, repairs and maintenance, rent, insurance, etc.
For a trading business, operating fixed cost is low. For big manufacturing companies like Steel, Cement, Auto, etc, operating fixed costs are high.
Debt and Equity
To meet the cost requirements of the company, it needs capital. A company can generate capital from equity and from debt. If the cost requirement is high, equity might not be enough to fund all costs. Hence, the company will have to resort to bank loans (debt).
Break-Even Point & Capacity Utilization
A Break-even point is a situation where the company is selling just enough to take care of its “operating fixed cost.” The higher is the company’s fixed overheads, the longer it takes for the company to reach its break-even point.
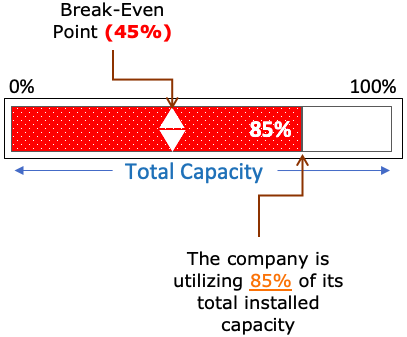
Suppose a company has the capacity to produce 1,000 number shoes in a day. If it produces and sells at least 45 nos, it will cover its fixed-overheads (break-even). If the company is producing all 1,000 shoes in a day, it is 100% capacity utilization.
What is the Leverage Effect?
A company that enjoys leverage will see its profits change disproportionately, even with a minute change in sales.
What causes leverage?
A combination of fixed cost and variable cost of a company cause the leverage effect.
Suppose there is a hypothetical company that has only variable costs, and its fixed cost is zero. If such a company sees a 5% increase in sales, its profits will also rise by 5%. But had the company maintained some fixed cost, profit increase would be higher.
Total Cost = Fixed Cost + Variable Cost
Considering that no listed company can have fixed costs as zero hence all companies display a leverage effect. Though, some have higher leverage than others. Such companies will show more dramatic changes in their profits for every change in sales.
Examples of Leverage Effect
We have said that a combination of fixed and variable costs causes the leverage effect. To better understand the effect of leverage, we will see three hypothetical examples.
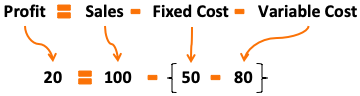
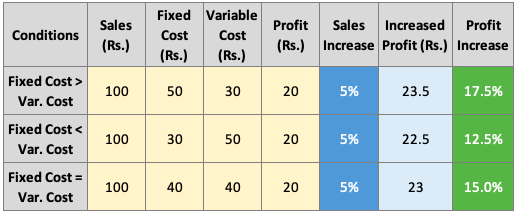
Example 1: (Fixed Cost is Higher than Variable Cost)
Suppose the total sales of a company is Rs.100 Cr. Its fixed cost is Rs.50 Cr and the variable cost is Rs.30. In this case, the profit of the company is Rs.20 Cr. (100 – 50 – 30).
Now suppose the sales of the company rose by 5% to Rs.105 Cr. The fixed cost will remain fixed at Rs.50 Cr. But because the sales have increased, say due to increasing in production, its variable cost will also see a 5% increase (from Rs.30 Cr. To Rs. 31.5 Cr.).
In this case, the profit of the company will be Rs.23.5 Cr (105 – 50 – 31.5). This is an increase in profit by 17.5% (from Rs.20 Cr to Rs.23.5 Cr)
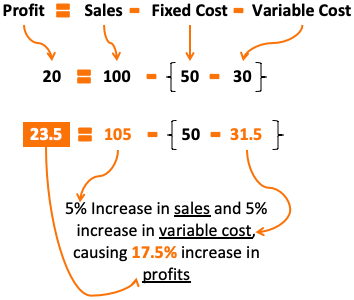
So you can see, a 5% increase in sales has caused a 17.5% increase in profits.
Example 2: (Fixed Cost is Smaller than Variable Cost)
Suppose the total sales of a company is Rs.100 Cr. Its fixed cost is Rs.30 Cr and the variable cost is Rs.50. In this case, the profit of the company is Rs.20 Cr. (100 – 30 – 50).
Now suppose the sales of the company rose by 5% to Rs.105 Cr. The fixed cost being fixed will stay at Rs.30 Cr. But its variable cost will also see a proportionate 5% increase (from Rs.50 Cr. To Rs. 52.5 Cr.).
In this case, the profit of the company will be Rs.22.5 Cr (105 – 30 – 52.5). This is an increase in profit by 12.5% (from Rs.20 Cr to Rs.22.5 Cr).
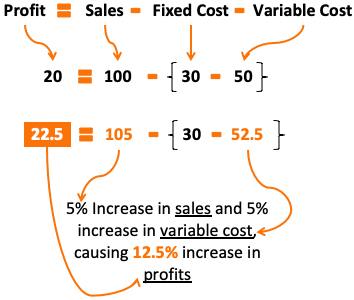
So you can see, a 5% increase in sales has caused a 12.5% increase in profits. Though, the growth rate was smaller than example #1 (where fixed cost was higher than variable cost).
Example 3: (Fixed Cost equals Variable Cost)
Suppose the total sales of a company is Rs.100 Cr. Its fixed cost is Rs.40 Cr and variable cost is Rs.40. In this case the profit of the company is Rs.20 Cr. (100 – 40 – 40).
Now suppose the sales of the company rose by 5% to Rs.105 Cr. The fixed cost being fixed will stay at Rs.40 Cr. But its variable cost will see a proportionate 5% increase (from Rs.40 Cr. To Rs. 42 Cr.).
In this case, the profit of the company will be Rs.23 Cr (105 – 40 – 42). This is an increase in profit by 15% (from Rs.20 Cr to Rs.23 Cr)
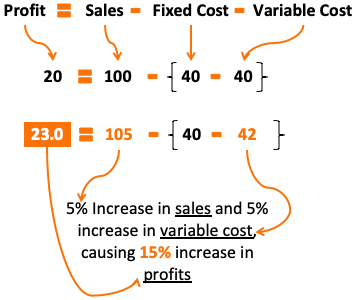
So you can see, a 5% increase in sales has caused a 15% increase in profits. The growth of 15% lies in between the growth calculated in example #1 and example #2.
What we can infer from this analysis?
When the total cost of a company is partially fixed and partially variable, any increase in sales will result in a disproportionate rise in profits. But such companies will also see a dramatic fall in profits (in % terms) when their sales fall.
This disproportionate impact on the company’s profits, for every change in sales, is what is called as leverage effect.
The biggest effect of leverage can be seen in all highly capital-intensive businesses (Like Manufacturing – mainly steel, cement, auto, among others).
But does it mean that all capital-intensive businesses make good stocks? Not necessarily. Why? Because with leverage comes the risk. This is why leverage analysis must be done to check if the stock is eligible for investing.
Formula’s To Remember
Before can know more about the leverage analysis, we will just try to remember the below formulas:
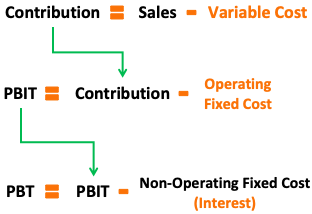
Profit = (Sales – Variable Cost) – Fixed Cost
Contribution = Sales – Variable Cost
Profit = Contribution – Fixed Cost
Quick Note:
For companies to enjoy the leverage effect, their cost structure must have fixed and variable components. Maintaining only variable costs is like training being unprepared for the test.
For example, a marathoner training only for a couple of weeks before the marathon is like “maintaining only variable costs.” Continuously training all the time for the marathon is like “maintaining fixed costs.” Yes, continuous training is costing. But its benefits will be visible in terms of enhanced performance during the race.
Examples of Fixed Cost of a Company
- Operating Fixed Costs
- Salaries
- Depreciation and Amortization (D&A)
- Rent / Lease
- Insurance
- Property Taxes
- Repairs and Maintenance
- Conversion Charges
- Royalty
- Allowance /provision
- Fixed Utility Bills
- Operating Variable Costs
- Interest Expenses
- Variable Costs
- Cost of Material Consumed
- Purchase of Stock-in-Trade
- Consumption of stores and spares
- Power and Fuel Cost
- Freight and handling charges (Transportation)
- Commission, discounts and rebates, etc.
Leverage Multiple
So now we know that companies with a combination of fixed and variable assets see a disproportionate increase in profits when their sales grow.
So, is it possible for business owners or investors to know the jump in profits straight away by looking at the magnitude of sales growth? Yes, informed guesswork is possible. For that, the “leverage multiples” of the company must be known.
As there are two types of fixed costs, operating fixed cost and non-operating fixed cost, there are two main types of leverages.
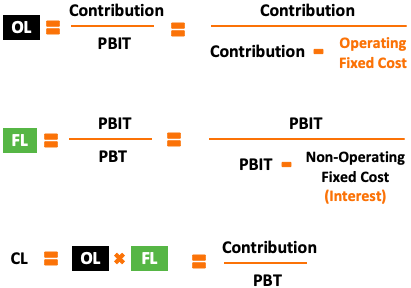
- Operating Leverage (OL)
- Financial Leverage (FL)
- Combined Leverage (CL)
Utility of Leverage Ratios (OL, FL, and CL)
– OL will tell how much PBIT will be effected by a change in sales.
– FL will tell how much PBT will be change for every change in PBIT
– CL will tell how much PBT will be change by a change in sales.
Example:
Suppose a company has the following leverage ratios:
- OL = 4,
- FL = 5,
- CL = 20
Now, for this company, if sales increases by 10%, PBIT increase will be:
- PBIT growth = Sales Growth x OL = 10% x 4 = 40%
If PBIT is growing by 40%, how much it will effect PBT?
- PBT Growth = PBIT Growth X FL = 40% x 5 = 200%
If sales increases by 10%, PBT increase will be:
- PBT growth = Sales Growth x CL = 10% x 20 = 200%
Leverage Analysis of Companies (Risk Analysis)
We can judge if the company is risky or safe for investing by doing a leverage analysis.
Based on leverages, all companies can be classified into the following four broad categories:
| Type | OL | FL |
| 1 | High | High |
| 2 | Low | Low |
| 3 | High | Low |
| 4 | Low | Low |
#1. High OL and High FL
The formula for operating leverage (OL) says OL will be high when “operating fixed cost” is high.
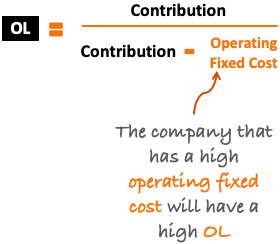
Considering that it is a fixed cost, it is not easy for companies to reduce this cost. Moreover, the higher is the “operating fixed cost”, the higher will be BREAK-EVEN for such companies.
How the company will achieve the break-even point? By generating higher contributions (Sales – operating variable cost). So for such companies, initial days are tough as they have to produce more to achieve break-even.
But as soon as they cross the barrier of break-even point, the benefit of leverage starts to kick in. Even a small increase in sales (beyond the break-even point) will result in a substantial increase in profits (PBIT & PBT).
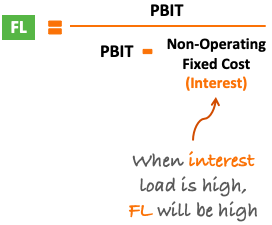
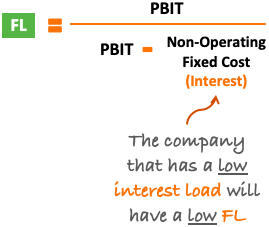
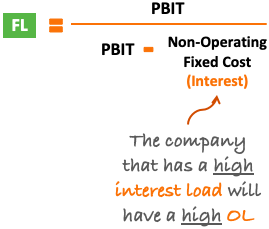
The formula for financial leverage (FL) says FL will be high when the Interest load of the company is high. When it will happen? When the company is borrowing more loans. This is a risk. Even banks will hesitate to lend money to a company that has a high FL & OL.
A company whose both OL and FL is high will also have a high Combined Leverage (CL). It means, even a small change in sales will dramatically increase the company’s PBT. Similarly, even a small dip in sales will bring the PBT crashing.
So, a high FL and High CL company is too risky for investing
[Quick Note: If the capacity of the company is to produce 1 million items, even if there is a demand, it cannot sell more than 1 million items. It means, there is also a limit to how much sales a company can grow.]
Till High FL and High OL type companies are making profits, and sales are almost stable, investing in such companies could be considered. But when sales are not consistent, such companies become too risky for investing.
#2. Low OL and Low FL
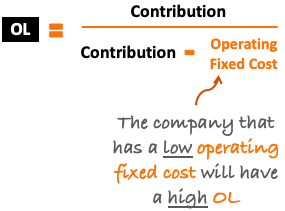
The formula for operating leverage (OL) says OL will be low when “operating fixed cost” is low. It means, such a company can produce and sell “less” and still achieve the BREAK-EVEN.
For example, a company has the capacity to produce 1 million items. At just 0.35 million levels it achieved its break-even. It means, if the company sells only 0.35 million items, it will cover all its operating fixed costs. This is what we can call “achieving break-even quickly”.
Now, what it means when its FL is also low?
The formula for financial leverage (FL) says FL will be low when the interest load of the company is low. It means, the company is borrowing fewer loans.
It is a point worth noting that, though the OL is low (break-even happens quickly), still the company is playing safe by taking fewer loans. Did they had access to more loans, they can use this capital to produce more and thereby see more sales. It is a great incentive to do after the company has achieved its break-even. But the company is playing safe by maintaining a low FL.
Such companies (low OL and low FL) are very credit worth. Banks would be happy to give loans to such a company. But from point of view of shareholders, such companies are LOW GROWTH RATE companies.
Hence, equity investors would not prefer investing in them.
#3. High OL and Low FL
Operating Leverage (OL) will be high when “operating fixed cost” is high. Please note that the companies often have no control over their fixed costs.
Such a company will have to produce and sell more (higher percentage of its installed capacity – Capacity utilization) to reach the BREAK-EVEN point.
Now, what happens after the company has done the hard work by producing close to its installed capacity (to achieve break-even)?
It is maintaining a low FL. Why?
[Quick note: If there is a demand, and equity capital is insufficient, companies must borrow money till it has utilized its full production capacity. Becoming too defensive about loans is not a good business practice.]
But high OL companies have a problem. Banks may not lend too much loan to such companies seeing their leverage multiples. Moreover, high OL companies must also keep tight control over their FL. Why?
Because a combination of High OL and High FL will make it a very risky organization (Type #1).
So we can say that this organization is thoughtful and careful – they are aware of the fact that their OL is high (over which they have no control). Hence, they must do things to keep the combined leverage from spiraling out of control. How? By keeping the FL low.
Growth investors would avoid investing in high OL companies. Why? Because even if the company desires, their growth rate numbers will remain only sober.
#4. Low OL and High FL
Low OL companies are lucky – they are able to achieve break-even at a much lower level of capacity utilization. Hence having a low OL is something that companies and their stakeholders must cherish.
How such an organization can take advantage of its luck? They can do it by using the borrowed money to achieve its capacity utilization.
Such type of companies (Low OL) has great growth potential by the use of borrowed money. Low OL companies are considered safe and also have high growth potential. How? They can borrow more money from banks and still keep their combined leverage (CL) within safe levels.
Let me give you examples of two types of safe companies.
Example #1
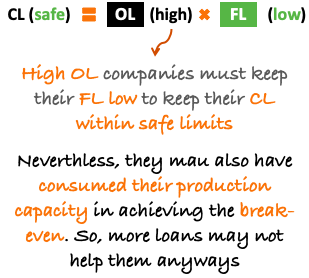
A combination of high OL and Low FL can also make a company safe.
High OL companies must always keep their FL low so as to maintain the CL within safe limits.
Nevertheless, High OL companies do not have a choice. They may also have consumed their production capacity in achieving break-even. So, more loans may not help them anyways. Moreover, banks may not issue higher loans to high OL companies.
So, you can see, high OL companies may look safe but it is only because of their self-inflicted limitations.
Example #2
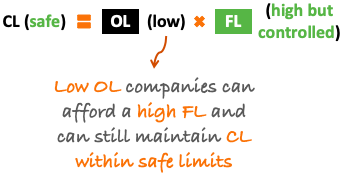
Low OL companies can afford a high FL and can still maintain the CL within safe limits.
The best thing about these companies is that lenders are always inclined to borrow money to them. Secondly, the company has practiced complete control over how much money they are borrowing. How? By keeping an eye of CL levels is the trick.
First, finalize an acceptable CL number, and always remain below it.
Conclusion
High OL Companies should rely less on loans.
Low OL companies can borrow more to boost growth. But if it is not doing so, its management is conservative. Not suitable for equity investors.
Low OL and High FL companies are Warren Buffett Type companies.
Example: Leverage Analysis Using Realistic Numbers of a Listed Company in India
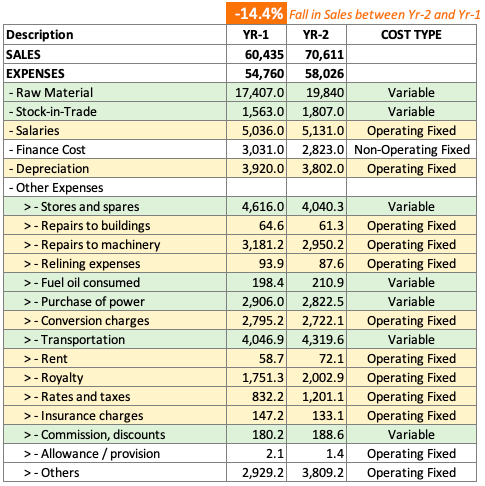
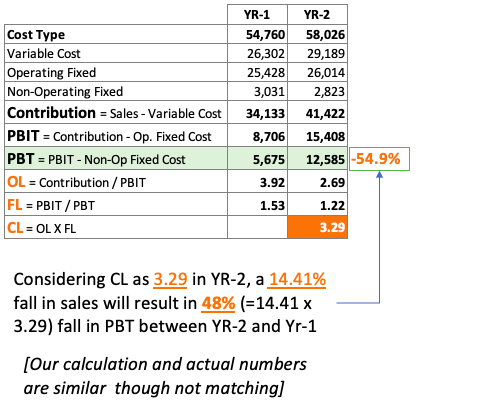
I’ve downloaded the sales and expense details of a company from its annual report (profit and loss accounts). This company saw as 14.41% fall in sales between year 2019 and 2020. You will see that, upon leverage analysis, the fall in Profit (PBT) was estimated as 48%. But in actual, the company saw a PBT fall of 54%.
Our calculation and actual numbers are similar though not matching. This example proves that a leverage analysis can surely give an idea about how much the profits of the company will change with a change in its sales.
I hope you enjoyed the analysis. Keep safe and have a happy investing.
Suggested Reading: