
Lupin Limited (BSE:500257) is an Indian Pharma stock. In terms of Market Cap, Lupin Ltd is the 5th largest stock after Sun Pharma, Cadila, Cipla and Piramal.
Lupin Limited is also among the Top 100 stocks of Indian stock market in terms of Market Capitalization. Lupin currently ranks as high as 64 in list of top 100 stocks.
Lupin has also been featured in the list of top 2000 world’s biggest companies by Forbes.
Lupin’s net sales is Rs.12,700 Crore. This makes it the biggest pharma company in India in terms of sales volume.
Lupin’s net profit is Rs.3,141 Crore. This again makes it the biggest pharma company in India in terms of net profit.
As quoted in Wikipedia, Lupin is the fifth biggest “generic drug” manufacturer in the US.
Desh Bandhu Gupta is the Founder of Lupin.
He started Lupin in 1968. Since then, he pioneered Lupin to become the “global pharmacutecial major” as it is seen today.
Lupin has presence in over 100 countries across the globe. It is one of the India’s most renowned and respected global MNC’s.
Recently in June’2017, Desh Bandu Gupta passed away at the age of 79.
Currently Lupin Ltd is managed by Vinita Gupta-50 (CEO) and Nilesh Gupta-44 (Managing Director). They both are daughter and son respectively of the late Desh Bandhu Gupta.
Lupin Limited is a company which is based in Mumbai. Once, Lupin was the world’s biggest manufacturer of Tuberculosis drugs.
Lupin has manufacturing facility in Anklaeshwar, Tarapur, Mandideep, Indore, and Vishakapatnam.
Short Term Price Trend of Lupin Ltd
It is very interesting for me to analyse short term price trend of my stocks.
Hence I like to create my own Simple Moving Average (SMA) graph for my stocks.
It shown the price trend for the following durations with respect to the current price levels.
- 12 months SMA
- 9 months SMA
- 6 months SMA
- 3 months SMA
For Lupin Ltd. the SMA is showing a continuous decline since last 12 months.
I use my stock analysis worksheet to build my SMA chart. This is the result for Lupin Ltd is as like this:
Lets do a detailed fundamental analysis of Lupin Ltd.
#1. Growth Rates:
I personally like stocks which show’s consistent growth in its past.
It becomes particularly interesting for me when I see a double digit growth rates.
The financial parameters that like seeing grow in a stock are as below:
- Free Cash Flow Growth
- Reserves Growth
- Income Growth
- Profit Growth
- Dividend Growth &
- EPS growth (my favorite)
I use my stock analysis worksheet to quantify all these values. This is the result for Lupin Ltd:
#2. Financial Ratios
The use of financial ratios helps users to comprehend the numbers easily. It helps to compare apple to apple.
Financial ratios also helps us to make the first impression about the stocks, before digging into the details.
The ratios that my worksheet highlights prominently are as below:
- Price Valuation
- Price to Earning Ratio (P/E)
- Price to Book Value Ratio (P/B)
- Price to Sales Ratio (P/S)
- Price to Free Cash Flow (P/FCF)
- Profitability
- Return on Equity (ROE)
- Return on Capital Employed (RoCE)
- Cash Returned on Invested Capital (CROIC)
I use my stock analysis worksheet to quantify all these values. This is the result for Lupin Ltd:
#3. Important Miscellaneous Data
Before investing, it is important to look at a few indicators that gives a rough idea about the current position of the stocks price.
What are these few indicators?
- Current price compared to its 52W high and Low price.
- How much the price changed in last 30 days and 12 months.
- What is the market cap.
- Compared to the Industry P/E, what is the P/E of stock.
- What is the price growth in last 3Y, 5Y and 10Y.
- What is the average dividend yield in last 3Y, 5Y and 10Y.
I use my stock analysis worksheet to get quick answers to these questions. This is the result for Lupin Ltd:
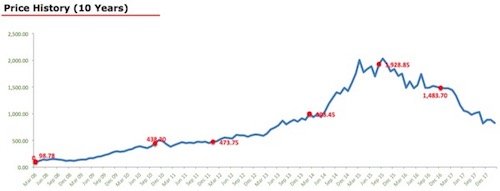
#4. Price Chart of Last 10 Years
Why I like to see price chart?
Frankly speaking price charts tell very less about a stock (unless you are a technical analyst).
But I still like to give it a glance. Why? It gives an idea of how the current price is placed compared to last 10 years trend.
There can be few scenarios here:
- If price is only bullish – current price can be overvalued.
- If Price is remaining modest – poses a question why price is not growing fast enough?
- When price is falling – current price can be undervalued or business fundamentals may be weakening.
I use my stock analysis worksheet to generate the 10 Year price chart. This is the result for Lupin Ltd:
#5. Quarterly Trends
Why to look at quarterly results?
For long term investors, long term trends are more valuable. But it is also essential that the investor should not miss noting the short term trends.
If in short term term, the income, earnings are falling, it poses a risk.
Investor must get the answers for the Why’s before proceeding.
The quarterly trends that I refer are as below:
- Total Income – TTM data verses last FY data (if rising or falling).
- Net Profit – TTM data verses last FY data (if rising or falling).
- Earning Per Share (EPS) – TTM data verses last FY data (if rising or falling).
I use my stock analysis worksheet to get pictorial chart for the above important informations. This is the result for Lupin Ltd:
#6. What is the Intrinsic Value of this stock?
This worksheet may not be accurate, but it attempts to estimate Intrinsic value of stocks.
I believe that, even if it is a rough estimation of intrinsic value, it is still worth doing it.
Because investing in a stock without comparing its intrinsic value with its current price is a big mistake.
Based on the knowledge that has been gathered, this worksheet attempts to estimate the intrinsic value of its stock.
There are several ways to estimate intrinsic value of a stock. But I rely more on the following methods.
I have incorporated all of my favourite method in my worksheet to estimate intrinsic value of stocks. An intelligent formula the generates the net intrinsic value of the stock derived from all these individual methods:
- DCF method
- NCAPS method
- Absolute PE method
- Reproduction cost method
- Benjamin Graham’s Formula
- Earning Power Value (EPV)
I use my stock analysis worksheet to estimate intrinsic value of stock. This is the result for Lupin Ltd:
#7. What is the final conclusion?
After considering almost all aspect of stocks as discussed above, my worksheet helps its user to arrive at a final conclusion.
What is the ultimate question in stock investing? The stock is good or bad? How to arrive at this conclusion?
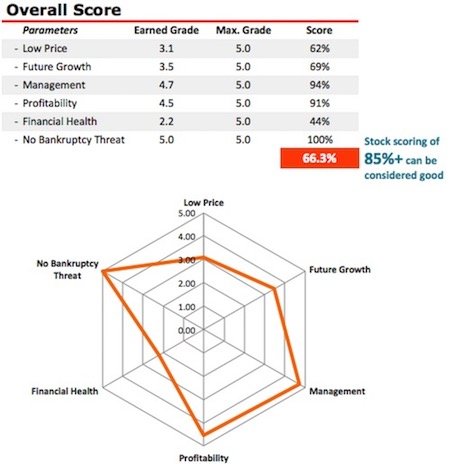
My stock analysis worksheet does this very nicely for me. Based on the following parameters, it generates an overall grade for its stock.
If the generated grade is above 85%, the stock is considered good.
Lets see what grades are generated for Lupin Ltd:
- The Overall grade for Lupin is 3%.
- The market price of Lupin seems to be priced higher. It scores 62%
- In terms of future growth prospects, Lupin gets 69%.
- Lupin earns a high 94%for its managements efficiency.
- In terms of profitability, Lupin again score a high of 91%.
- Financial Health of the company is presently bad at 44%.
- There is no bankruptcy threat to Lupin. It earns 100%
It must be noted that, this worksheet gives more importance to the price valuation of stock. A stock which is priced right will score higher.
This worksheet gives score to its stocks very defensively.
There are not many stocks in the market that can earn grade above 80% from this worksheet.
Lupin Ltd has scored just 66.3%, but I still considered it as a good stocks.
We are aware that the whole Pharma Sector is facing a crisis due to USFDA. This is the reason why, since couple of years a stock like Lupin is underperforming.
I believe that stocks like Lupin will eventually get out of the problem created by USFDA. But it may take some time. Till then Lupin will remain weak.
This stocks is ideal for long term investors. Sure, there is a risk. But Lupin is a prime company.
I think one can include it in ones stock watch list and wait for further price correction.

Good article all aspects of lupin is covered
Please share your analysis on auto sector. I also done it but required little more information.