
Option chain analysis is a tool that can add to the investment strategy of long-term investors. In this article, I’ll first talk about the fundamentals of option chain analysis. We will also see how to navigate NSE India’s option chain data. Then we will demonstrate the potential benefits of the option chain, for those who prefer to buy and hold strong stocks for the long term.
Select an F&O Query
The Option Chain serves as a potent instrument for long-term investors. It can enable investors to gain valuable insights about the market and specific stocks. By comprehending the data within the Option Chain, investors can make well-informed choices about their stock holdings. This data can empower investors to take advantage of the market volatility. Knowledge of option chain analysis aligns with the long-term investment objectives of stability, growth, and wealth preservation.
Option chain analysis is a valuable tool for long-term equity investors even if they don’t plan to trade options. It provides crucial insights into market sentiment, helping investors gauge future stock movements.
Even for those, not trading in options, understanding and using option chain data can enhance their stock market awareness. It builds into the theory that, “informed decisions in equity investing is a must for long-term success.”
Table of Contents
- #1: Understanding the Basics
- – 1.1 What are “Options”?
- – 1.2 What are the Lot Size and Premium?
- – 1.3 How Profit is Made in Option Trading?
- – 1.4 What is Option Chain?
- – 1.5 What is Intrinsic Value in Option Chain?
- – 1.6 What is ITM and OTM in Option Chain?
- – 1.7 Option Selling vs. Option Buying
- #2: Navigating NSE’s Option Chain Data
- – 2.1 Strike Price
- – 2.2 Open Interest (OI)
- – 2.3 Change in OI
- – 2.4 Volume
- – 2.5 Implied Volatility
- #3: How To Analyze Option Chain Data?
- – #3.1 Access the NSE India Website
- – #3.2 View The Option Chain Data
- – 3.3 Interpret The Option Chain Data
- Conclusion
#1: Understanding the Basics
#1.1 What are “Options”?
Options are financial derivatives that get their value from underlying stocks or an index. As we invest in stocks and mutual funds, derivatives are a type of equity-based investment option. Futures are Options are two types of derivatives that people trade and make money.
Derivatives give us the right, but not the obligation, to buy (call) or sell (put) a specific stock at a predetermined price (strike price) before or on a set date (expiration date).
Imagine you really like a company’s stock called “ABC Inc.” It’s currently trading at ₹100 per share, and you believe it will go up in the future. You could buy a call option for ABC Inc. with a strike price of ₹110 and an expiration date of three months.
If, by that date, the price of ABC Inc. has gone up to ₹115, you can use your call option to buy it at the lower strike price of ₹110 and make an immediate profit of ₹5 per share.
On the other hand, if the price of ABC Inc. falls or doesn’t change much, you’re not required to buy the stock.
You can simply walk away, and the only cost is the price you paid for the call option. When you buy a call option, you pay only a price called the premium for the option. The premium is separate from the stock price. For example, if you purchase a call option for a stock with a strike price of ₹110 and a premium of ₹5, you pay ₹5 upfront.
This premium gives you the right, but not the obligation, to buy the stock for ₹110 which can be valuable if the stock’s price rises above ₹110.
#1.2 What are the Lot Size and Premium in Options Trading?
Let’s use ITC, as an example for trading stock options.
Lot Size: For ITC, the lot size is typically 1,600 shares. This means that when you trade options on ITC, you’re dealing with options contracts that represent 1,600 shares of the underlying stock.
Premium: The price you pay for an option is called the “premium.” This premium varies and depends on factors like the strike price, the time to expiration, and market conditions. Let’s assume you’re interested in an ITC call option with a strike price of ₹435, and the premium is ₹15 per share. Since the lot size is 1,600 shares, the total premium for one contract would be ₹15 x 1,600 = ₹24,000.
#1.3 How Profits Are Made in Options Trading?
Suppose, today (23-Oct-2023) you purchase a call option for ITC with a strike price of ₹435 and a premium of ₹15 per share having an expiry date of 26-Nov-2023. In this case, you pay only ₹24,000 (₹15 x 1600 nos) and acquire the right to buy those 1,600 shares on 26-Nov-2023.
Now, suppose on 26-nov-2023, the stock price goes up to ₹460. You can exercise your call option and buy the same at a price of ₹435 (₹25 less than the current price).
Here’s how you make a profit on 26-Nov-2023:
- You exercised the option and bought 1,600 shares of ITC at the strike price of ₹435.
- Now, you can also sell these 1,600 shares on the same day.
- In the market, the current stock price is ₹460 per share. In this scenario, your profit would be ₹25 per share (₹460 – ₹435) = ₹25 per share.
- How much will be your profit? ₹40,000 (₹25 x 1,600).
#1.4 What is Option Chain?
An “option chain” is like a menu of choices for trading options on a specific stock. Imagine you’re in a restaurant, and the menu lists various dishes with different prices and ingredients. In a similar way, an option chain provides a list of options (Call and Put options) for a particular stock, each with its own set of features.
For example, let’s say you’re interested in buying options for Company XYZ. You’d look at the option chain for Company XYZ, and it would show you different options like this:
- Call Options: These are like orders to buy the stock at a certain price before or on a specific date.
- Call Option A: Buy XYZ stock at ₹100 by December 1st.
- Call Option B: Buy XYZ stock at ₹110 by December 1st.
- Call Option C: Buy XYZ stock at ₹120 by December 1st.
- Put Options: These are like orders to sell the stock at a certain price before or on a specific date. It’s similar to saying, “I’ll sell this dish from the menu at a fixed price.”
- Put Option X: Sell XYZ stock at ₹90 by December 1st.
- Put Option Y: Sell XYZ stock at ₹80 by December 1st.
- Put Option Z: Sell XYZ stock at ₹70 by December 1st.
Just like in a restaurant, you can choose the option that suits your preferences. Option chains show you different “dishes” (options) with varying prices (strike prices) and expiration dates, so you can select the one that best matches your investment goals and expectations for the stock. It’s like having a menu of choices to customize your investment strategy.
#1.5 What is Intrinsic Value?
It is the difference between the current market price of the underlying asset (e.g., a stock) and the option’s strike price.
For call options:
- Intrinsic Value = Current Market Price of the Asset – Strike Price
- If the result is positive, the call option has intrinsic value because you could buy the asset at a lower price using the option.
For put options:
- Intrinsic Value = Strike Price – Current Market Price of the Asset
- If the result is positive, the put option has intrinsic value because you could sell the asset at a higher price through the option.
#1.6 What are ITM, OTM, and ATM in the Options Chain?
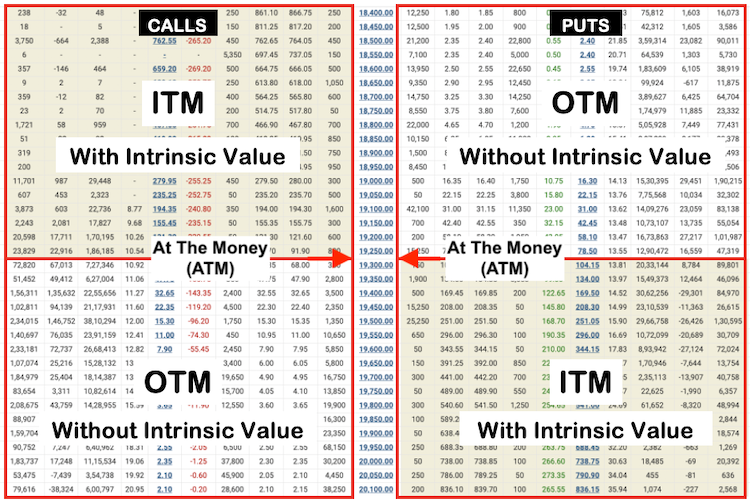
Options with intrinsic value are said to be “In-the-Money” (ITM), and this intrinsic value can be realized by exercising the option.
Options without intrinsic value are “Out-of-the-Money” (OTM) and rely entirely on their time value, which is based on factors like market expectations and volatility.
“At-the-Money” (ATM) is the Strike Price where the premium is close to zero. At ATM, the Strike Price is theoretically equal to the current market price (say for a stock or of the index 50 index).
This strike price is often a significant focal point for options traders. Why? Because it represents a point where the option’s strike price is very close to the actual market price of the underlying index. We’ll read more about it in Section #3.
#1.7 Option Selling vs. Option Buying
Buyer of the Option (Call) Mindset:
- Bullish Expectation: Option buyers believe the price of the underlying asset (a stock) will rise. They purchase call options to profit from this upward movement.
- Example: If an investor expects the stock price to go up in the next month, they might buy a call option for the stock at a particular strike price (e.g., Rs.400). This allows them to buy the stock at Rs. 400, even if it rises to Rs. 415, making a profit.
- Limited Risk: Option buyers have a well-defined risk. They can only lose the premium paid for the call option. For example: If they paid Rs. 20 as the premium for the call option, the maximum they can lose is Rs. 20 times the lot size. If the lot size is 1000 shares, then the total loss will be limited to Rs.20,000 only.
Seller of the Option (Call) Mindset:
- Neutral to Bearish Outlook: Option sellers have a neutral or slightly bearish view. They believe the stock price will remain stable or even decrease.
- Example: Suppose a trader expects the stock to trade within a range or possibly decrease slightly. They may sell a call option at a strike price of Rs. 400. If the stock doesn’t rise above Rs. 400 (remains flat or the price falls), in both cases, they keep the premium they earned by selling the option.
- Higher Risk: Option sellers, especially naked call sellers, have potentially unlimited risk if the stock price rises significantly. This can lead to substantial losses. For example: Suppose a trader expects the stock to trade within a range or possibly decrease slightly. Hence he sells a call option at a strike price of Rs. 400. If the stock’s price rises significantly (e.g., Rs. 450), the call seller might be forced to buy the stock at Rs.450 and then sell it to the call buyer at Rs.400 as agreed upon earlier as per the contract. This results in a significant loss.
Option Buyer (Put) Mindset
- Objective: Option buyers purchase put options to profit from falling prices. They believe the stock’s value may decrease.
- Example: An option buyer purchases a put option for a stock with a strike price of Rs. 1,000 by paying a premium of Rs. 50. They expect the stock’s price to fall below Rs. 1,000. The option buyer will profit if the stock price falls below the strike price (1,000). This will allow the buyer to sell the stock at a higher price than the market value.
Option Seller (Put)
- Objective: Option sellers aim to generate income by selling put options, and they profit from stable or rising stock prices. They believe the stock’s price will remain above the strike price.
- Example: Let’s say an option seller sells a put option for a specific stock with a strike price of Rs. 1,000 and receives a premium of Rs. 50. They believe the stock price will stay above Rs. 1,000 by the option’s expiration date. The option seller profits as long as the stock price remains above the strike price. In this case, they keep the premium received from the put option sale.
Section 2: Navigating NSE’s Option Chain Data
To begin, visit the National Stock Exchange (NSE) India’s website and locate the option chain data for your chosen stock. It’s often under the “Derivatives” section. Once you find the stock you’re interested in, you’ll see a table of ‘Call’ and ‘Put’ options with various strike prices and expiration dates.
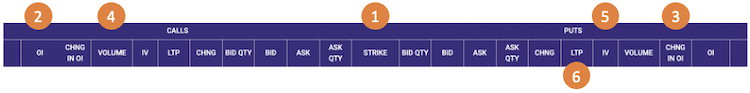
Key Elements on the Option Chain Page
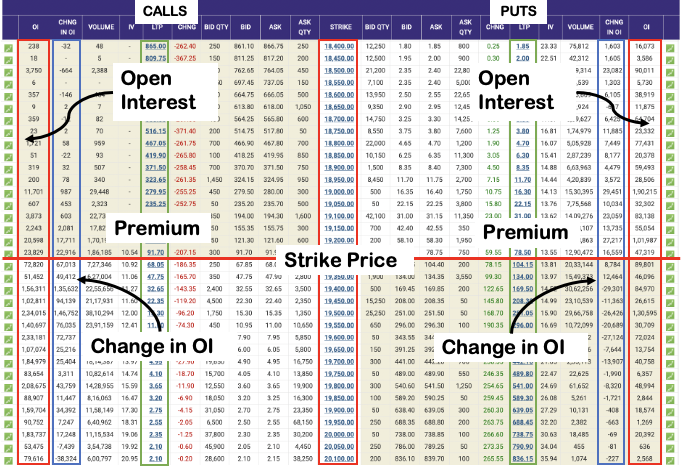
#2.1 Strike Price
If we are talking about a stock, the strike price is basically different variations of the market price of that stock.
It is like a special price tag for a specific dish on a restaurant menu. It’s the price at which you agree to buy or sell a stock when you use an option. Think of it as the fixed cost for a particular food item.
For example, if you see a call option with a strike price of ₹200 for a stock, it means you can buy that stock for ₹200 if you have that option.
If you come across a put option with a strike price of ₹150, it means you can sell that stock for ₹150 using that option.
The strike price helps you know exactly how much you’ll pay or get paid when you use the option.
While doing an option chain analysis of a stock, we are actually trying to arrive at a conclusion that a particular strike price (stock price), whether it is worth buying/selling. This is decision is made by comparing what all other options traders are doing at that strike price.
#2.2 Open Interest (OI)
If we are talking about a stock, open interest is similar to the number of orders placed on the exchange to buy to sell a stock.
It is like the number of orders for a specific dish on a restaurant menu. It shows how many people have shown an interest in buying or selling that particular option.
For example, What does it mean if you see a call option with an open interest (OI) of 1,000? It means 1,000 people have placed orders to potentially buy that option.
On the other hand, if you spot a put option with an open interest of 500, it means 500 people are interested in selling that option.
Open interest (OI) can give you an idea of how popular a particular option is. It’s one of the things to consider when doing option chain analysis.
This figure shows the number of option contracts that are currently open. A large number of open interest shows high interest (to buy to sell) at a strike price.
#2.3 Change in Open Interest
If we are talking about a stock, a change in OI is similar to the change in the number of orders (to buy or sell a stock) between two consecutive days. It helps us track market sentiment and investor interest.
For instance, if you see a “Change in Open Interest” of +100, it means 100 new option contracts were created that day. It indicates a growing interest in that option. Conversely, a -50 indicates 50 contracts were closed, showing reduced interest.
A rising change suggests increasing attention, possibly signaling a bullish or bearish sentiment.
Imagine a restaurant adding more of a popular dish to the menu; it could imply a growing demand, indicating a market trend.
OI and ‘Change in OI’ data must be read together while making the option chain analysis.
#2.4 Volume
It is like the number of orders placed for a dish on a restaurant menu during a specific day. It shows how many contracts were bought or sold in one trading day.
In contrast, OI represents the total number of contracts that exist, including those created in previous days (it shows a cumulative value). Please note that all OIs have an expiration date. For example, if the Call option is bought today (23-Oct-2023), whose expiry date is 02-Nov-2023, it will continue to show in the Option Chain data, as OI, till 02-Nov-2023.
Volume is a daily count of contracts traded. While Open Interest is the overall tally of outstanding contracts.
It’s like tracking how many orders were placed today (Volume) versus how many orders are still on the menu (Open Interest).
#2.5 Implied Volatility (IV)
It is like a weather forecast for the stock market. It tells us how much people expect the stock’s price to change in the future.
For instance, if IV is low, it’s like expecting calm weather, indicating that the stock’s price may not fluctuate much. But if IV is high, it’s like preparing for a storm, suggesting that the stock’s price could have significant swings.
IV helps traders gauge market uncertainty and can influence their option trading choices. Just like checking the weather before planning an outing, understanding IV helps traders make informed decisions based on market expectations.
#2.6 Last Traded Price (LTP)
LTP is a crucial piece of information because it tells us the most recent price at which a specific option contract changed hands in the market. To put it simply, it’s the last price that someone was willing to buy or sell that option for.
Now, let’s talk about the relationship between LTP and the strike price.
LTP is the price at which the trade is taking place. Strike Price is the price of the underlying asset (like Nifty) seeing which the decision is taken to trade or not trade.
LTP is also referred to as the “Premium” in the Options trading.
Section 3: How To Analyze Option Chain Data?
Interpreting the Option Chain data means analyzing and making sense of the information presented in the option chain for a particular stock or Index. It involves understanding the various components of the option chain, such as call and put options, strike prices, open interest, volume, implied volatility, and expiration dates.
We have already understood the definition of these terms in sections #1 and #2 above.
Traders and investors use this data to make informed decisions to trade, hedge investments, and predict market trends.
Example
Let’s take the example of the ‘Option Chain analysis of Nifty50’ on NSE India’s website. This analysis can help traders make informed decisions based on the available data.
Here’s a step-by-step guide on how to perform option chain analysis:
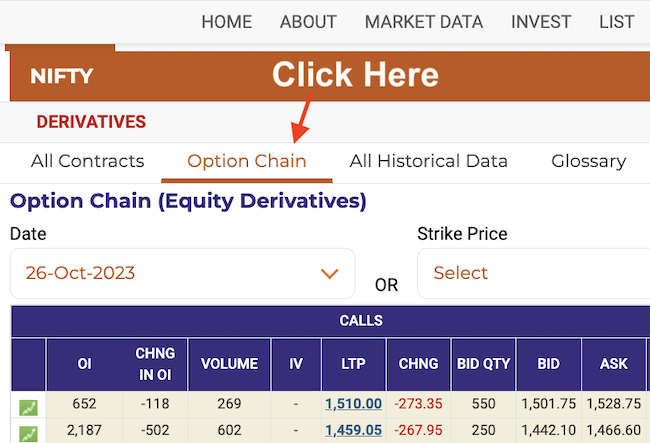
#3.1 Access the NSE India Website
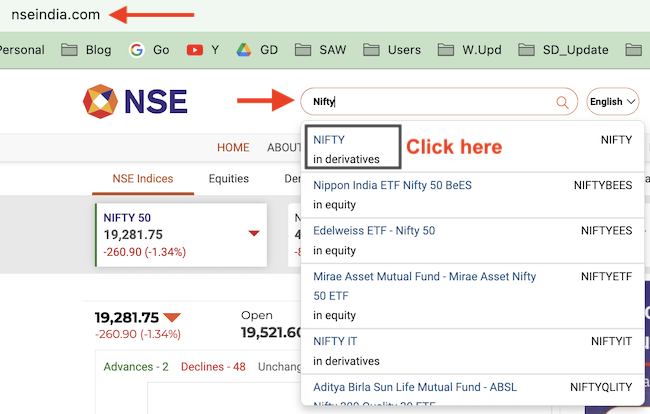
Open the official NSE India website (https://www.nseindia.com/). Look for the search box at the top and search for your derivative like Nifty, Reliance, TCS, Asian Paints, etc.
Upon search, a drop-down menu will open. Click the name of your displayed asset “in the derivate” category. For example, if you search for the Nifty Index, you will see the result as shown in the above screenshot.
Click on the preferred result. It will take you to the derivative page of the equity. On the derivative page, you must click on the “Option Chain” menu. It will take you to the option chain data of Nifty. As of date, the option chain data of the contract expiring on 26-Oct-2023 is visible.
From the Date’s drop-down menu, you can view and select from multiple expiry dates.
#3.2 View The Option Chain Data
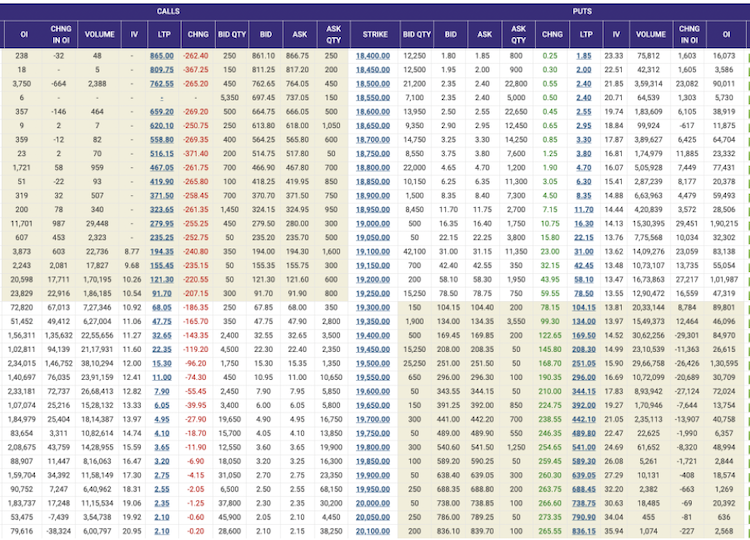
Once the option chain data opens, what you will see is the following, with terms like Calls, Puts, Strike Rate, OI, Change in OI, Volume, and IV. We’ve already discussed (above) about the meaning of these terms in Option Chain Analysis.
#3.3 Interpret The Option Chain Data
First Step: At-the-Money (ATM) Analysis
- The ATM strike price is the one closest to the current level of the Nifty 50 index. This strike price represents a point where the option’s strike price is very close to the actual market price of the underlying index.
- Monitoring the ATM strike is valuable. It helps traders understand the current market sentiment and the potential balance between bullish and bearish expectations.

- If the ATM call and put options are similarly priced, it suggests that market participants are relatively unsure about the index’s future direction. How to do it?
- Identify the strike price that is closest to the current Nifty 50 index level. This is usually referred to as the ATM strike.
- Locate the LTP for both the Call and Put options at the ATM. Now, Compare the LTPs.
- If the LTP on the Call side is very close to the LTP on the Put side, it suggests that market participants are relatively unsure about the index’s future direction.
- In the above screenshot, we can see that the LTP on the call side is 64.9 and on the put side is 107. So they are not evenly priced. So, we’ll proceed to the next step.
- If there’s a significant price difference, it may indicate a stronger bullish or bearish sentiment.
- If the LTP on the call side is significantly higher than the LTP on the put side, it indicates a more bullish sentiment. In such a case, the index is likely to go up.
- If the LTP on the call side is significantly lower than the LTP on the put side, it suggests a more bearish sentiment. In such a case, the index is likely to go up.
- In the above screenshot, we can see that the LTP on the call side is significantly lower (64.9 vs 107) than on the put side. Such a market is more likely to fall in the next trading day.
- Consider Magnitude: Pay attention not only to whether the LTPs are similar or different but also to the magnitude of the difference. A small price difference might indicate a more neutral or balanced market sentiment, while a significant difference could imply a stronger bullish or bearish bias.
Second Step: Looking Around Holistically
1. Spot Price and Strike Selection
Begin by noting the current spot price of the Nifty index. This is the level at which Nifty is currently trading. To identify potential trading opportunities, select specific strike prices close to the spot price. For instance, if Nifty is at 19,300, consider strike prices such as 19,100 and 19,500.
2. Open Interest (OI)
Open Interest represents the total number of outstanding option contracts at a given strike price. A high OI suggests strong market interest and potential support or resistance levels. When analyzing OI, focus on key strike prices near the spot price.
Example: If you observe high OI at the 19,100 strike price for Nifty PUT options, it indicates significant market attention at that level. Traders anticipate a possible support point.
3. Change in Open Interest
Track changes in OI to gauge market sentiment. A rising OI indicates new positions, suggesting bullish or bearish expectations. A declining OI suggests unwinding positions, possibly indicating a shift in market sentiment.
Example: If OI for 19,300 PUT options increased significantly over a few days, it may imply growing bearish sentiment as traders anticipate Nifty’s fall below 19,300.
4. Volume
Volume represents the number of option contracts traded at a specific strike price during a trading session. High volume at a strike indicates significant trading activity and potential price action around that level.
Example: If Nifty PUT options with a strike of 19,100 experience a sudden surge in volume, it may signal increased bearish interest and a potential support test.
5. Implied Volatility (IV)
IV reflects the market’s expectation of future price volatility. A high IV indicates uncertainty, while a low IV suggests stability.
Analyze IV for both CALL and PUT options to understand market expectations.
Example: Elevated IV in both 19,300 CALL and PUT options implies an expectation of a significant Nifty price movement. Traders anticipate a potential breakout.
6. Option Chain Patterns
Identify patterns such as put-call ratios. A skewed put-call ratio may suggest market sentiment.
Example: A higher put-call ratio may indicate a bearish sentiment.
Remember, practice and continuous learning are essential for mastering the art of option chain analysis.
Conclusion
While option chain analysis is often associated with short-term trading strategies and hedging, it can be a tool for long-term investors as well. The data-driven insights derived from option chain analysis provide a unique perspective on market sentiment.
- Entry and Exit Points: Long-term investors can use option chain data to identify advantageous entry and exit points. By monitoring key support and resistance levels, they can make well-informed decisions on when to accumulate or trim their stock positions.
- Diversification: By analyzing option chains of various stocks in their portfolio, long-term investors can better diversify their holdings. Diversification helps spread risk and manage portfolio volatility.
Incorporating option chain analysis into a long-term investment strategy is not about speculating but about enhancing decision-making.
By harnessing the power of this tool, investors can navigate the stock market with greater confidence. As the investment landscape evolves, option chain analysis remains a valuable resource for both traders and investors.
Have a happy investing.


Dear Mani,
It is really simple great explanation about the Option chain with example, It is really useful beginner like me.
I have doubt on the following line :
If the LTP on the call side is significantly lower than the LTP on the put side, it suggests a more bearish sentiment. In such a case, the index is likely to go up.
Since It is bearish market will go down instead of up , Please correct me if i am wrong.
Thanks & Regards
Anandan
Hi Anandan, A higher Put LTP (compared to Call LTP) indicates stronger demand for puts, which generally signals bearish sentiment. However, if the index still moves up despite this, it suggests that sellers of put options (who are usually large institutional players) are confident the market will rise. This is often seen in reversal scenarios.