Today we’re diving into the finances of Pilgrim’s Pride Corporation (PPC), one of the heavyweights in the chicken production industry. I’ve been crunching some numbers from their 5-year financials. Whether you’re a seasoned investor or just someone curious about where to park your money, this blog post will help.
First Impressions: Who Is Pilgrim’s Pride?
If you’re not familiar, Pilgrim’s Pride is a big name in the poultry game.
They’re one of the largest chicken producers in the U.S., with operations stretching to Puerto Rico, Mexico, and even international markets like the UK and Asia. They’re a subsidiary of JBS S.A., the Brazilian meat-processing giant, and they’ve been around since 1946.
From fresh chicken to fully cooked nuggets, they supply retailers, restaurants, and grocery stores with a variety of products under brands like Just BARE and Gold Kist.
Enough about their business model, let’s talk numbers and see if this company is worth your investment dollars.
The Income Statement: Revenue Growth and Profitability Trends
Top Line (Revenue)
Let’s start with the top line: revenue. Over the past five years, Pilgrim’s Pride has shown a solid upward trend in total revenues:
| SL | Year | Total Revenue (in million $) | YOY Growth |
|---|---|---|---|
| 1 | 2020 | 12,091.90 | – |
| 2 | 2021 | 14,777.46 | 22.21% |
| 3 | 2022 | 17,468.38 | 18.21% |
| 4 | 2023 | 17,362.22 | -0.61% |
| 5 | 2024 | 17,878.29 | 2.97% |
| – | – | CAGR (5Yrs) | 8.14% |

That’s a compound annual growth rate (CAGR) of about 8.14% from 2020 to 2024, which is pretty impressive for a company in a relatively mature industry like poultry.
The jump from 2020 to 2021 (22.21% growth) likely reflects a rebound from pandemic-related disruptions, with demand for chicken soaring as restaurants reopened and consumers stocked up on protein. However, growth slowed in 2023 (a slight dip of 0.6%) before ticking up again in 2024 (3%).
This tells me that PPC has been navigating some volatility, possibly due to inflation, supply chain issues, or fluctuating feed costs, but they’ve managed to keep revenue relatively stable.
Gross Margin
Now, let’s talk profitability. Their gross profit margin has been a bit of a rollercoaster:
| SL | Year | Gross Margin (%) | YOY Growth |
|---|---|---|---|
| 1 | 2020 | 6.93% | – |
| 2 | 2021 | 9.24% | 33.33% |
| 3 | 2022 | 10.37% | 12.23% |
| 4 | 2023 | 6.44% | -37.90% |
| 5 | 2024 | 12.94% | 100.93% |
| – | – | CAGR (5Yrs) | 13.30% |
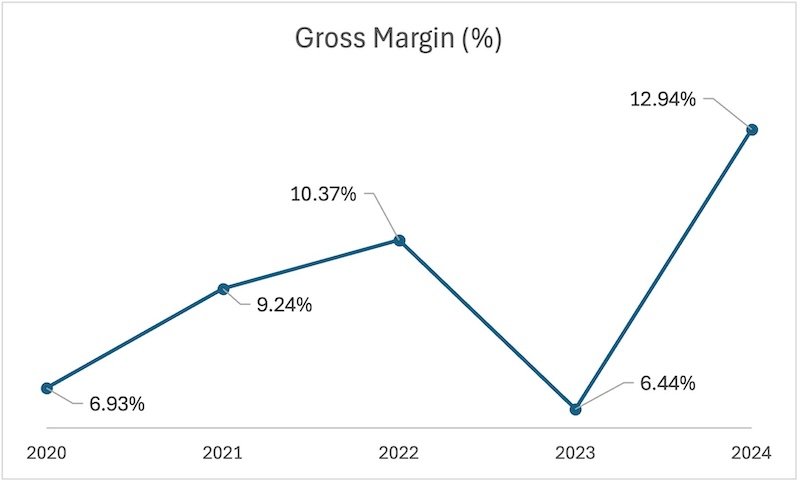
The jump in 2024 to 12.18% is a standout. It suggests PPC has either improved operational efficiencies, negotiated better pricing, or managed input costs (like feed and labor) more effectively.
On the flip side, the dip in 2023 to 6.44% raises a red flag, margins took a hit, possibly due to rising costs or competitive pricing pressures.
EBITDA and Net Margin
When we drill down to EBITDA margin and net income margin, the story gets even more interesting:
| SL | Year | EBITDA Margin | Net Margin |
|---|---|---|---|
| 1 | 2020 | 4.82% | 0.78% |
| 2 | 2021 | 4.05% | 0.21% |
| 3 | 2022 | 9.22% | 4.27% |
| 4 | 2023 | 5.90% | 1.85% |
| 5 | 2024 | 12.18% | 6.08% |
| – | CAGR (5Y) | 20.37% | 50.79% |
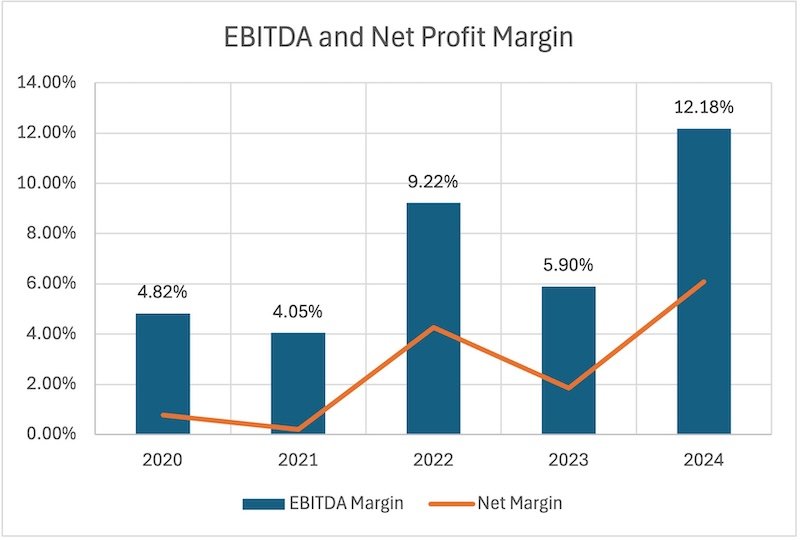
The net income margin in 2024 (6.05%) is a huge improvement from the razor-thin 0.21% in 2021. This aligns with what I’ve seen on the news mentioning PPC’s strong Q4 2024 performance, with adjusted net income hitting $1.086 billion. But let’s not get too excited just yet because we must also look at how much of net profit is geting translated into EPS (or EPS is getting diluted).
Earnings Per Share (EPS)
| SL | Year | EPS | YOY Growth |
|---|---|---|---|
| 1 | 2020 | 0.39 | – |
| 2 | 2021 | 0.13 | -66.67% |
| 3 | 2022 | 3.10 | 2284.62% |
| 4 | 2023 | 1.36 | -56.13% |
| 5 | 2024 | 4.57 | 236.03% |
| – | – | CAGR (5Yrs) | 63.60% |
The EPS (earnings per share) also reflects a good growth trend, growing from $0.39 in 2020 to $4.57 in 2024 (CAGR 63%). That’s a solid sign for shareholders, but the variability in margins over the years suggests PPC is sensitive to external factors like commodity prices or regulatory challenges (more on that later).
The Balance Sheet: Stability and Leverage
Next up, let’s peek at PPC’s Balance Sheet to understand their financial health and how they’re managing assets, liabilities, and equity.
| SL | Year | Total Asset | YOY Growth |
|---|---|---|---|
| 1 | 2020 | 7,474.50 | – |
| 2 | 2021 | 8,913.21 | 19.25% |
| 3 | 2022 | 9,255.77 | 3.84% |
| 4 | 2023 | 9,810.36 | 5.99% |
| 5 | 2024 | 10,650.58 | 8.56% |
| – | – | CAGR (5Yrs) | 7.34% |

Assets have grown steadily, up 42% from 2020 to 2024. This growth likely comes from investments in production facilities, acquisitions, or working capital to support their expanding operations. But here’s where it gets tricky, let’s look at their liabilities:
| SL | Year | Total Debt | YOY Growth |
|---|---|---|---|
| 1 | 2020 | 2,570.67 | – |
| 2 | 2021 | 3,571.82 | 38.95% |
| 3 | 2022 | 3,502.63 | -1.94% |
| 4 | 2023 | 3,612.30 | 3.13% |
| 5 | 2024 | 3,466.24 | -4.04% |
| – | – | CAGR (5Yrs) | 6.16% |
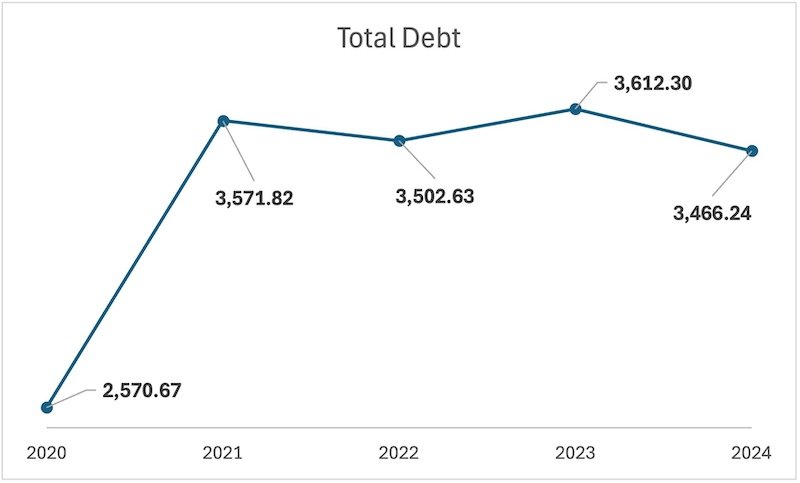
Debt spiked in 2021 but has since stabilized, even dropping slightly in 2024. Still, $3.46 billion in debt isn’t pocket change.
When I calculate their debt-to-equity ratio (total debt divided by total equity), here’s what I get:
| SL | Year | D/E |
|---|---|---|
| 1 | 2020 | 1.00 |
| 2 | 2021 | 1.38 |
| 3 | 2022 | 1.23 |
| 4 | 2023 | 1.08 |
| 5 | 2024 | 0.81 |
The debt-to-equity ratio has crept up, meaning PPC is relying more on borrowed money relative to shareholder equity. This isn’t necessarily a dealbreaker, especially since their interest coverage (EBITDA divided by interest expense, which isn’t provided but can be inferred) seems to have improved with the 2024 EBITDA margin spike.
Still, it’s something to keep an eye on, especially if interest rates rise or if margins shrink again.
| SL | Year | Total Debt | YOY Growth |
|---|---|---|---|
| 1 | 2020 | 547.62 | – |
| 2 | 2021 | 427.66 | -21.91% |
| 3 | 2022 | 400.99 | -6.24% |
| 4 | 2023 | 697.75 | 74.01% |
| 5 | 2024 | 2,040.83 | 192.49% |
| – | – | CAGR (5Yrs) | 30.10% |
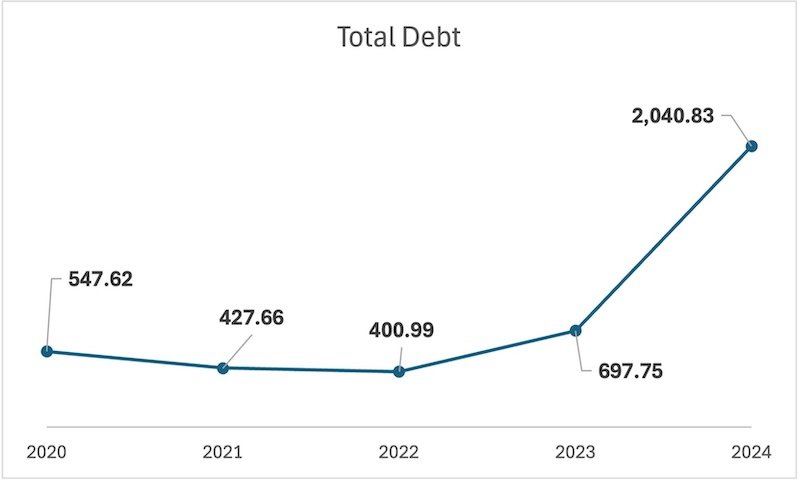
Whoa, look at that cash balance in 2024. It’s ballooned to over $2 billion, up from $547.62 million in 2020. This gives PPC a nice liquidity cushion to weather any storms, pay down debt, or invest in growth. It’s a reassuring sign of financial stability.
The Cash Flow Report: Where’s the Money Going?
Cash flow is where the rubber meets the road, it shows how well a company generates and manages its cash.
| Cash Flow Report (in Mn USD) | 2020 | 2021 | 2022 | 2023 | 2024 |
|---|---|---|---|---|---|
| Cash from Operations | 724.25 | 326.46 | 669.86 | 677.88 | 1,990.13 |
| Capital Expenditure | -354.76 | -381.67 | -487.11 | -543.82 | -476.15 |
| Free Cash Flow | 333.65 | -12.96 | 160.9 | 94.48 | 1,467.05 |
| Beginning Cash Balance | 279.8 | 525.95 | 416.35 | 401.28 | 728.9 |
| Ending Cash Balance | 547.62 | 427.66 | 400.99 | 697.75 | 2,040.83 |
Operational cash flow in 2024 is a blockbuster at $1.99 billion, a massive improvement from the $336.46 million low in 2021. This aligns with their improved profitability and suggests they’re running a tighter ship operationally.
PPC has been investing heavily in its business, CapEx has hovered around $350–550 million annually. This could be for upgrading facilities, improving efficiency, or expanding capacity, which is a good sign for long-term growth. However, it’s eating into their free cash flow (FCF).
That’s a healthy FCF, giving PPC flexibility to pay down debt, issue dividends, or reinvest.
The reported FCF tells a similar story, 2024 is a standout year, while 2021 was rough with negative FCF. This volatility is something to watch, as it reflects how sensitive PPC’s cash flows are to operational hiccups.
Price-Related Data: Is the Stock a Buy?
Now, let’s tie this all together with PPC’s current price-related data as of early March 2025:
- Current Price: $54.78
- P/E (TTM): 11.92
- P/B: 3.03
- P/FCF: 8.76
- Shares Outstanding: 237.122 million
- Market Cap: $54.78 × 237.122 million = $12.99 billion (approx.)
The P/E ratio of 11.92 is relatively low for a company with a 2024 EPS of $4.57, that’s a good sign it might be undervalued compared to the broader market (the S&P 500 average P/E is typically around 20–25).
The P/B ratio of 3.03 suggests the market values PPC at three times its book value, which isn’t crazy high but indicates some growth expectations baked into the price.
The P/FCF of 8.76 is particularly attractive—FCF is a great metric for valuation, and a low P/FCF suggests the stock could be a bargain.
The Bigger Picture
From a fundamental perspective, PPC looks like a solid contender in 2025. Revenue growth is steady, profitability is on the upswing (especially in 2024), and their cash position is stronger than ever. The stock’s valuation metrics also suggest it might be undervalued, making it an intriguing pick for value investors.
But there are risks to consider. The poultry industry is notoriously cyclical, with margins sensitive to feed costs, consumer demand, and regulatory pressures. PPC has also had legal troubles in the past, like the $110.5 million fine in 2020 for price-fixing—which raises governance concerns.
Plus, their debt levels, while manageable, could become a burden if interest rates climb or if margins shrink again.
Conclusion
If you’re thinking about investing in Pilgrim’s Pride, here’s my two cents, the company is in a strong position heading into 2025, with improving profitability and a hefty cash reserve.
The stock looks reasonably priced, especially with that low P/FCF ratio. But keep an eye on industry headwinds and their debt load.
If you’re a long-term investor who can stomach some volatility, PPC might be worth a closer look. Maybe start with a small position and see how they perform over the next few quarters.
What do you think? Are you considering PPC for your portfolio, or are you looking at other sectors? Let me know in the comments, I’d love to hear your thoughts.
And if you found this deep dive helpful, share it with a friend who’s into investing.
Until next time, happy investing.
- Suggested Reading: What’s the estimated Intrinsic Value of Pilgrim’s Pride (PPC).