
The stock comparison tool was one of the first tools which I developed in excel. In the last few days, we have made it more online savvy. Now, this tool can fetch stock data automatically upon click of a button.
The worksheet also has few limitations. It works only on MS EXCEL. To use it, one must have a decent internet connection. The worksheet has a list of total 1002 nos stocks available for comparison.
Earlier this tool had a static database. I used to send three updates of it (once every 30 days) to its new users. But now the dependency on 3 updates are gone. New users can click a button to fresh the stock data from our database.
At the moment, we are updating our database once every week (every Friday). But as we get more conversant with database management, we will re-fresh its contents more frequently.
Even when this tool had a static database, I used to love it. Even today, this is one of my first tools which I use in the process of researching my stocks.
In this article I’ll explain how I use the stock comparison tool for myself. This way you can also get a clue about its features, and usage for yourself.
Stock comparison tool is not sold as an independent product. One can buy it at as a package in product basket. My product basket also has other tools like Stock Analysis Worksheet, Mutual Fund Comparison Tool etc.
Topics
- Utility of stock comparison tool.
- Features of the tool.
- How to use Stock Comparison Tool.
Utility of Stock Comparison Tool
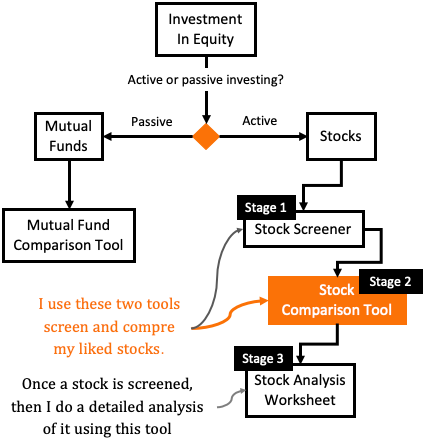
While we are planning to invest in equity, we face a basic question, “we would like to do an active or passive investing“? What is active investing? When investor has to self analyze shares and then invest in them directly it is active investing. While passive investing is done through a third party (outside expert) – like mutual funds, Exchange Traded Funds (ETFs) etc.
Once we’ve answered this basic question, we’ll have two types of investment options in front of us: mutual funds and stocks. If choice is mutual fund, as-much self-research and involvement is not necessary. But in direct stocks investing I follow a three stage approach:
The Three Stages
- Stage #1 (Screening): Generally I start with my stock screener. It is a web application having database of 3,800+ number stocks. We can use this screener to identify our stocks by applying several filters. I generally focus on those profitable stocks (high ROE, RoCE) which are trading at low P/E, low P/b etc.
- Stage #2 (Comparing): This is where my stock comparison tool comes into play. Suppose, the above screener gave me five high quality stocks (high revenue/profit, high profitability etc). I use the stock comparison to compare these 5 stocks based on 40+ parameters. This is how I’ll pick my best stock out of the lot of five.
- Stage #3 (Detail Analysis): A detailed analysis is done by my stock analysis worksheet. Good stocks obtained from the ‘stock comparison tool’ is analysed using stock analysis worksheet. This is one of a unique excel based tool. It is the most valuable product of our product basket.
Features of ‘Stock Comparison Tool’
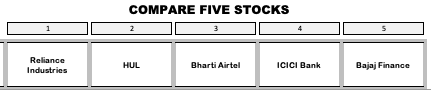
Stock comparison tool can compare five stocks at a time. This worksheet has a dynamic database which can be refreshed once every week (on Saturday’s). The tool also presents the selected five stock’s data-sheet in a simple and intuitive format. Read more about how to use this tool.
The worksheet can compare stocks based on 40+ parameters. Allow me to show you and explain the various parameters and their relevance.
#1. General Data
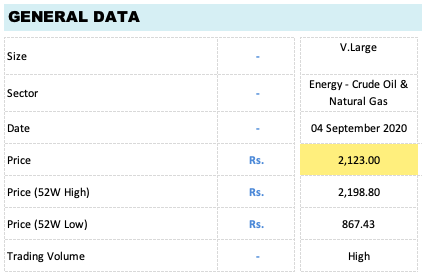
- #1 Size: There are 1002 numbers stocks in the worksheet’s database. All those stocks has been categorized into five types based on their market cap. Five types are: (a) Very Large, (b) Large, (c) Mid Size, (d) Small, and (e) Very Small. Categorisation gives a better sense of size to the users.
- #2 Sector: Name of a company often does not speak about its nature of business. Hence to get a general idea about it, looking into the sector in which it operates, helps.
- #3 Date: The date indicated here show’s the day in which the database of the sheet has been last updated. This gives a sense to the users that the price data there are referring belongs to which time frame.
- #4 Price: There are three kind of price data indicated here. First is the current price. The next two data is ’52 Week High’ price and ’52 Week Low’ price. These represents two extreme price movement in a time span of last one year. Comparing ‘current price’ with ’52W High and Low’ gives an understanding about current price being high or low.
- Trading Volume: Stocks which are traded more often in stock market has a high volume. Ideally speaking, one should prefer investing in ‘high volume’ stocks. All stocks are categorized into three types based on their trading volumes (High, Medium and Low).
#2. Price Valuation
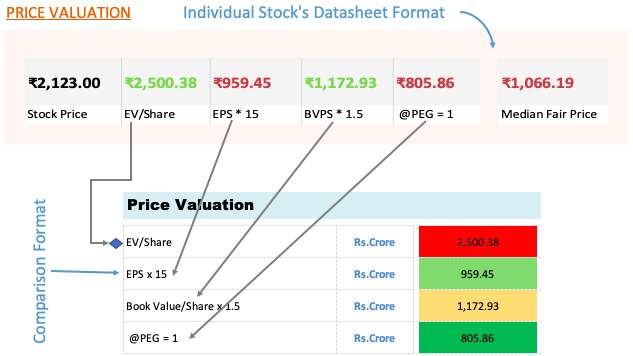
- #1. EV/Share: This is Enterprise Value (EV) of a company expressed in per share form. EV is nothing but Market Capitalisation adjusted for debt and cash (EV=Mcap+Debt-Cash). This is a more realistic representation of the true value of a company as compared to market cap. Read more about enterprise value.
- #2. EPS x 15: Benjamin Graham states that a P/E ratio of 15 or below indicates that current price is trading at fair levels. Using this analogy, multiplying current EPS of a company with 15 will give us its fair price. Ream more about it in stock for defensive investors.
- #3. BVPS x 1.5: Like PE15 rule, Benjamin Graham also believed in BVPS1.5 rule. If current price is at 1.5 times or below its ‘book value per share (BVPS)’ the stock may be fairly priced. Read more about it in book value of shares.
- #4 @PEG=1: This is an important metric of stock comparison tool. A stock whose PEG is less than or equal to one (1) may be treated as fairly priced. So this metric in the comparison table shows what? It tells us, what should be price of the stock so that its PEG will come as at least one (a). Read more about it in this article on PEG ratio.
#3. Size of Company
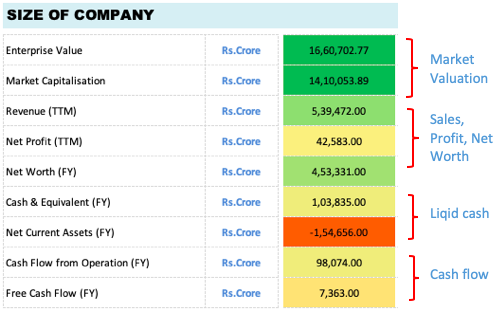
- #1 Market Valuation: It is interesting to compare stocks based on their market valuation. It gives an idea that which stock is more liked by the market. The parameters based on which market valuation is compared are (a) market capitalisation, and (b) enterprise value. Read: Book value, vs Market value.
- #2. Sales, Profit & NW: The best measure of the size of company is based on its fundamentals. When I say fundamentals it is mainly revenue, net profit (PAT), and Book Value (Net Worth). Comparing stocks based on these 3 parameters gives us the true estimate of its bulk. Why size is important? Because it is also an indicator of its market share over its competitors. Read more about MOAT companies.
- #3. Liquid Cash: Though liquid cash in isolation is not much of a meaning for analysts, but we can still use it as a measure of size. A company which looks cash-rich are liked by investors. Though a more apt measure of company’s health is liquidity ratios.
- #4. Cash Flow: The first things that investors like to see in a company is their ability to generate “positive cash flows”. Cash flow is also used by analysts to measure intrinsic value of a company (like in DCF model). One of the best measures of cash flow of a company are (a) cash flow from operations, and (b) free cash flow.
#4. Past Returns
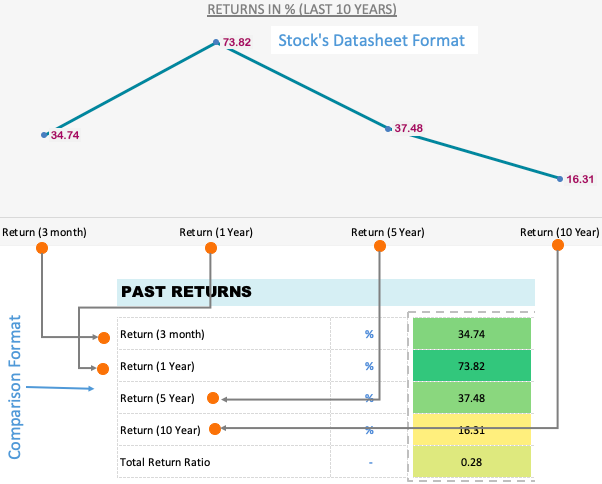
Five companies are compared based on their historical returns (CAGR). For sake of convenience and ease-of-comprehension, the return numbers are presented in five parts: (a) last 3 months, (b) last 12 months, (c) last 5 years and (d) last 10 years. Comparing five stocks based on their past returns is one of my favourite past-times 🙂 . Read more about how to measure investment returns in Excel.
#5. Price Valuation Ratios
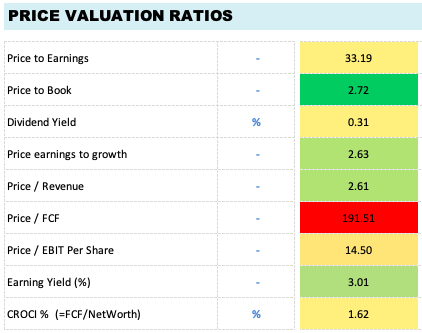
In #2 above, what we saw was price valuation of stocks based on their intrinsic value. Here, we can compare stocks based on the ratios which also hints about its approximate price valuations. Few ratios that we use here to draw a comparison is P/E, P/B, PEG, Dividend Yield etc. Though a more detailed article on price valuation ratios is here. Please go ahead and read it as well please.
#6. Financial Health

- #1 Altman Z-Score: It gives companies a score. The lowest score is zero (0) and goes higher. The higher is the score the better. A company with a high score has no bankruptcy threat. It means a high scoring company will never become a Kingfisher, Yes Bank, DHFL etc. Rule of thumb: Safe company is one which score 5 or above. Negative Z score is a clear sign of bankruptcy happening anytime soon.
- #2. Piotroski F-Score: The company’s F-score is based on 9 parameters. Every parameter will fetch one point for the company upon its compliance. According to me, F-score is one of the most powerful tool to measure the financial health of a company. Read more about the 9 parameters of F-score.
- #3. D/E and ICR Ratio: Debt on its own is not bad. But when debt level crosses a threshold it starts to become a cause of worry. One of the measure of this threshold is Debt-Equity (D/E) and Interest-Coverage (ICR) ratio. Comparing company of the same sector using D/E and ICR ratio gives good insight about their debt levels. Read more about debt free company.
- #4. Current Ratio: This is a measure of company’s ability to pay its current liabilities. Non payment of liability leads to bankruptcy. Current ratio (CR) = Current Assets / Current Liability. If CR is one or more means the company’s current assets can cover its current liabilities. Read: Net Current Asset Value of a company.
- #5. Dividend Payout Ratio (DRP): This is a measure of how much of its net profit (PAT) the company is sharing with its shareholders. Large blue chip companies share more profits as dividends, hence their DPR is high. Growing companies prefers to retain their profits, hence their DPR is low.
#7. Profitability
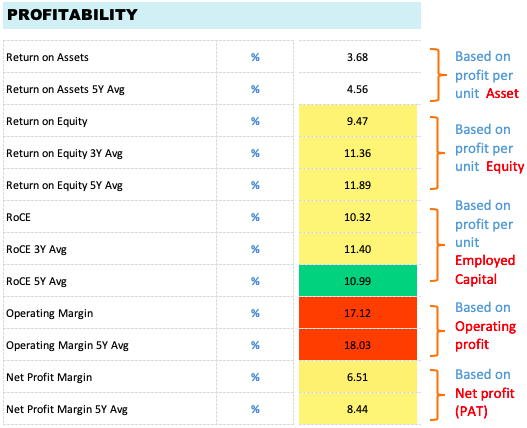
The stock comparison tool uses several metrics to check a company’s profitability. The measurement of profitability is done with respect to total assets, total equity, employed capital, operating profit and net profit (PAT) of the company. Out of all these, analysts give more weightage to ROA, ROE and RoCE. Read more about how to do profitability analysis of a company.
Comparing companies based on these profitability metrics gives a clear idea about their inherent strength (profitability of business).
Example, a manufacturing based company will be less profitable than a services based company. Similarly a company operating in the sector of “utility supply” – like power, water etc will have lower profitability. Likewise, franchisee based companies will show comparatively a higher profitability numbers.
Suggested Reading: Highly profitable companies operating in India.
#8. Past Growth Rates
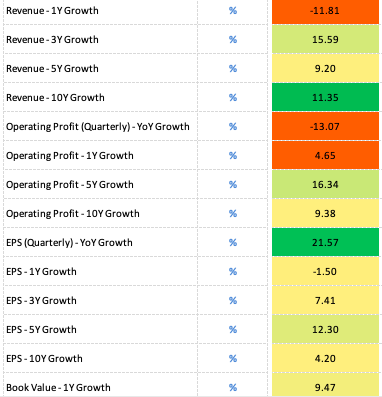
What is the point behind seeing the past growth rate numbers? It gives an idea about the future growth prospects of the company. Which parameters we should select to check the growth rates? The most important number is earnings (profit). But we must also checked the linked parameters which eventually leads to profit-making for the company.
Moreover, seeing growth numbers for only one quarter or one year is not enough. To get a clear long term view, last 3, 5 and 10 years growth numbers shall be seen.
This worksheet uses growth numbers for the metrics like total revenue, operating profit, earning per share (EPS), and book value.
How to Use The Stock Comparison Tool?
You can use the following steps as your guide. But even before you can use the file, you must Enable Macros for the worksheet when prompted.
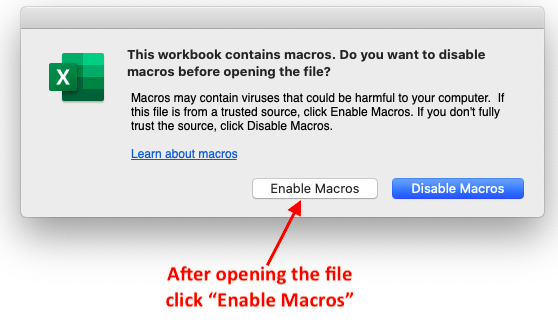
If “Enable Macros” prompt does not appear after opening the file, please change the macros setting in the trust centre.
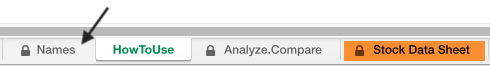
- Step #1: First go to the sheet called “Names”. Here in this sheet you will find a list of 1002 nos stocks. These are stocks which can be compared using this tool. The list of stocks has been carefully selected. You will find almost all quality stocks listed here.
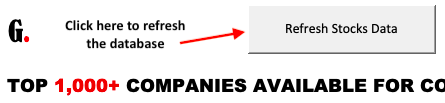
- Step #1.1: You can refresh database on every Saturdays. You shall click the “Refresh Stocks Data” button to fetch the new data.
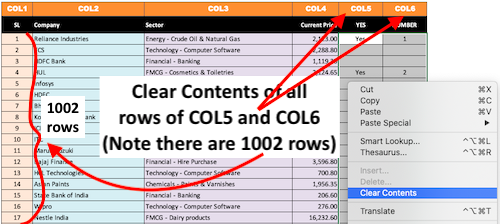
- Step #2: Clear the contents of columns marked as COL5 and COL6. Please note that there are 1002 number rows that needs to be cleared. To clear the contents, select all 1002 rows of COL5 and COL6, then right click, then click ‘Clear Contents’.
- Step #3: You will have to put “Yes’s” and “number the Yes’s from 1 to 5”. Check this video guide to learn how to put YES and then number them from 1 to 5. Please note that this video guide is of the older version. So please do not get confused when your sheet looks slightly different. Just use this video for “Yes’s and its numbering”.
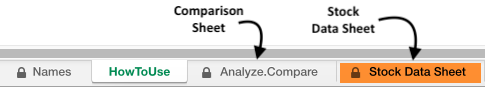
Step #4: The final report can be checked in the below shown two sheets.
Conclusion
This tool gives a complete picture about a company. Starting from price, price valuation, size, returns, past returns, financial health, profitability, growth rates – the worksheet touches all relevant metrics.
As the ‘stock comparison tool’ can compare five stocks based on these metrics, this further enhances its value for its user. As I said before, this worksheet is one of my first developments, but even today its utility seems like ever increasing.


Is there any installation required to work with this excel files?
It is a simple excel file. Read more about it here: https://bit.ly/385JEPO
Got your Stock analysis tool, in stock comparison sheet it prompts that the sheet is locked, and requires password…..
I don’t have a password…….
The sheet is protected. Please use it as directed. The password prompt will not bother you.
Hi Mani,
I purchased version V3.01 on 28th Dec 2020, Now you have changed algorithm of intrinsic value in version V3.1 on 31st Dec 2020, which means you will send this updated link to my Email ID or it will automatically updated in the files you already sent me from instamojo. Please advise.
Hi Mani,
I had purchased V3 of the stock analysis sheet last year, but I didn’t get the stock comparison tool along with it. Looks like I can’t purchase it separately. In order to get it, do I still have to purchase the new version of V3.1 stock analysis sheet, because currently I am happy with the older version of V3 sheet and I also want to use stock comparison tool?
I had bought xls v3.01,can you share v3.1?
Hello sir,
How can I update stock comparison tool. the data showing in comparison tool are very prior,about 2-3 months. How can I access the latest data for comparison atleast 1 one prior data.
Two updates has been emailed to you post purchase. They have an updated database. Thanks