The purpose of this blog is to highlight the use of the Magic Formula. Joel Greenblatt published the concept in his book called “The Little Book That Beats The Market” in 2006. The author shared a straightforward methodology to screen stocks of profitable companies available at a comparatively undervalued price. Undervaluation is measured using earning yield and profitability using return on capital. For quick answers, read the FAQs.
Introduction
Suppose there is a grocery shop that yields a steady cash flow for its owner. The profit and loss accounts say the shop made a profit of Rs.12,00,000 in the last FY (Financial Year).
Moreover, the owner has also divided the ownership of the shop into 10 lakh number shares each. Hence, the profit per share (PPS) of the grocery shop comes out to be Rs.1.2 per share.
Now, the owner wants to sell the grocery shop. His asking price for the shop is Rs.24 per share.
If you want to buy the grocery shop, would you buy it at Rs.24 per share?
How to analyze this share purchase? First, calculate the investment yield. Then calculate the profitability of the business. Once these two mertics are knows, use a suitable interpretation to understand if the purchase will be worth it. Ideally, a profitable company showing high yield becomes a good buy.
Let’s learn more about the investment yield first.
Yield on Investment
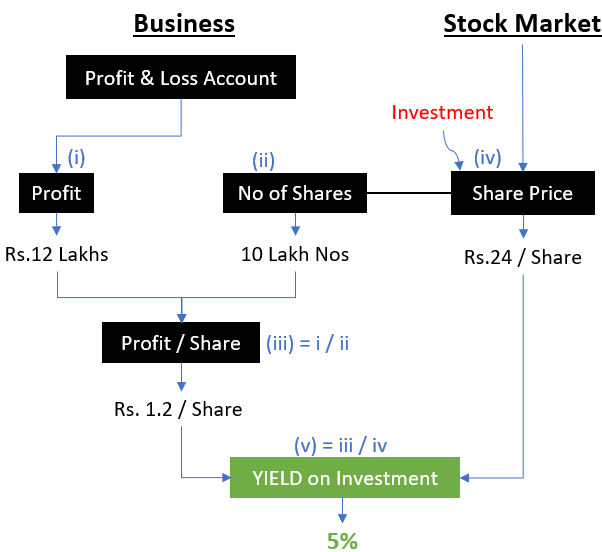
We’ll read the above flow chart with the objective of understanding the concept of investment yield.
From the point of view of the buyer, there are two basic aspects of any acquisition, (1) Total cost of acquisition and (2) Return on Investment (profit / Yield).
- #1. Cost of Acquisition (Investment): The 100% ownership of the grocery shops is offered at Rs.24 per share.
- #2. Profit Potential (Return): In the last financial year the shop made a profit of Rs.1.2 per share. We are making an assumption that going forward, it will at least yield this many returns.
The yield on investment is analyzed by comparing the profit emanating out of the investment with the cost of acquisition. In terms of a formula, it will look like this:
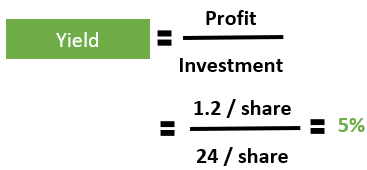
The total profit generated by the company is Rs.1.2 per share. The total investment is Rs.24 per share. Hence, the yield on investment will be 5% (=1.2/24).
Now, using investment yield as an analogy we’ll understand the concept of earnings yield.
Earnings Yield
The earning yield is calculated using EBIT as profit and Enterprise Value (EV) as the cost of acquisition (investment).
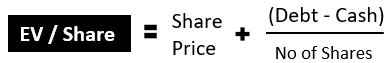
The EBIT of the grocery shop is Rs.1.2 per share. To calculate enterprise value (EV) we will need two more data from the balance sheet, debt, and cash. In terms of formula, the EV looks like this:
Let’s apply our understanding of yield on investment to contemplate the concept of earnings yield.
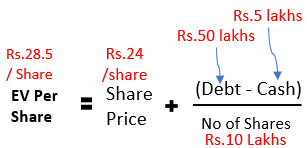
- #1. Cost of Acquisition (Enterprise Value): It is the cost of owning 100% equity after considering the net debt in the balance sheet. What is net debt? Debt minus cash. Suppose one bought 100% ownership by paying Rs.24 per share. But after the purchase, he found that it also carries Rs.50 lakhs debt and Rs.5 lakhs cash. So, the net debt transferred to the new owner is Rs.45 lakhs. It is equivalent to Rs.4.5 per share (=45/10). Hence, the cost of acquisition increased from Rs.24 to Rs.28.5 per share.
- #2. Profit Potential of the company: In the last financial year, the shop reported an EBIT of Rs.1.2 per share.
In terms of the flow chart, the earning yield will look like this:
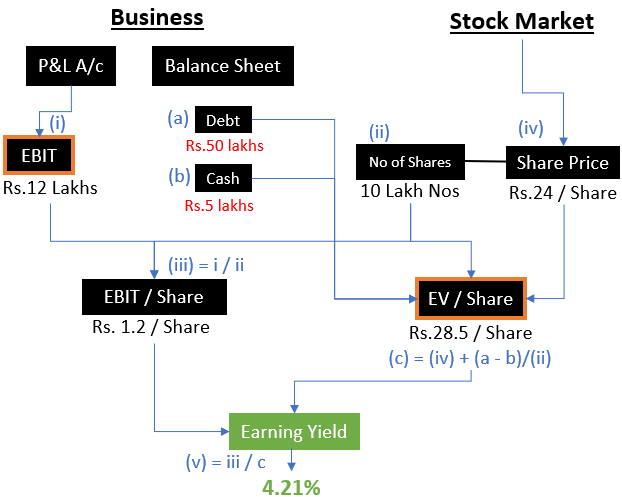
Please note how the presence of debt in the balance sheet has lowered the investment yield from 5% (in the above example) to 4.21%.
Hence, instead of using the “share price” to calculate the yield, one must use enterprise value per share (EV/share). It will give a more realistic estimate of the return on investment.
This is the reason why Joel Greenblatt has proposed the use of EV/Share in the Magic Formula instead of only the share price.
Limitation of the Earning Yield
In the numerator of the earning yield formula, we have EBIT. We’ve considered the EBIT number for the last financial year. But what happens to our earning yield estimate if the grocery shop generates a lower EBIT, than Rs.1.2/share, in the future?
How to ensure the EBIT generating capability of the shop.
To get a feel for the future EBIT potential of a company, Joel Greenblatt proposes the use of one more metric in the Magic Formula. It is the return on capital.
A company with high profitability (the return on capital) is more likely or maintain or improve its past profits (EBIT) in the future.
Let’s get more information on the concept of “return on capital.”
Return on Capital Employed (ROCE)
Once again we’ll have to open the balance sheet of the grocery shop. There you’ll have to find two numbers, total assets, and current liabilities. Using these two numbers we’ll compute the total capital employed by the grocery shop. Read more about Return on Capital Employed (ROCE) here. In terms of formula, ROCE looks like this:
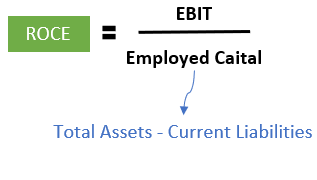
Suppose the total asset of the company is Rs.2.2 Crore and its current liability is Rs.25 lakhs. Using the above formula, the employed capital comes out to be Rs.1.95 Crores. Hence, the ROCE of the company will be 6.15% (=12/195).
The higher the ROCE, there is a better chance that the grocery shop will continue to improve its EBIT in times to come.
As a rule of thumb, In India, a ROCE above 15% is acceptable. A high ROCE is an indicator of how efficiently the company is using its capital to generate profits.
The Magic Formula
What is the magic formula to screen stocks? I apply Greenblatt’s magic formula to screen stocks using the following steps:
- Step#1: I download the constituent stocks of the S&P BSE 500 Index. The significance of this list is that these are the top 500 companies in the Indian stock market. The approximate market cap of the constituent companies remains above Rs.1,500 crore level.
- Step#2: As stated by Joel Greenblatt in his book, all companies in the financial sector like banks, NBFCs, Insurance, etc should be removed from the list.
- Step#3: Record the earnings yield and Return on Capital Employed (ROCE) of each stock that remains in the list.
- Step#4: Give ranks to each company based on their earnings yield and ROCE numbers. Suppose there are 450 stocks in the list. The company with the highest earning yield will get a rank of one, and the lowest will get a rank of 450. Repeat the same process for ROCE. After completion of this step, there will be two columns of Rank, one for earnings yield and the second for ROCE.
- Step#4: Add both the ranks of each company to get a combined rank. Suppose a company gets an earnings yield rank of 2 and the ROCE rank of 40. The combined rank of this company will be 42 (=2+40).
- Step#5: Sort all stocks based on their combined rank. The sorting must be done in ascending order. The stock will the lowest combined rank will come at the top and the highest rank stock will fall to the bottom-most position.
According to Greenblatt, the stocks coming at the top of the list are good companies. These are profitable companies available comparatively at an undervalued price.
How to use the list for investing – The Magic Formula Method
Target the top 20 stocks on the list.
- Buy 5 to 6 stocks every month. Keep buying the stocks till the total number of stocks in the portfolio is about 20 numbers. Note the date of purchase of each transaction
- Henceforth, go on to hold the stocks for 11 months calculated from the date of the transaction.
- All stocks that have completed the holding period of 11 months and are showing negative returns must be sold at least ONE week before the completion of 12 months.
- All stocks showing positive returns must be sold after ONE week from the completion of 12 months of holding time.
- Reinvest the proceeds accumulated from the sale of stocks to again buy the top stocks on the list.
- This process of buying and selling must be repeated for the next 10 years.
This is Joel Greenblatt’s methodology to practice the magic formula investing. As per Greenblatt’s research, this form of investing gives above-average returns.
Conclusion
I’ve implemented Joel Greenblatt’s method of screening stocks based on earnings yield and ROCE. I’ve also added a few variables of my own to generate a unique algorithm. The top stocks in this list will get a higher GMR score.
Very soon this screening methodology will appear in our stock screener theme as The Magic Formula.
I personally do not follow the magic formula investing methodology of Joel Greenblatt. Why? Because buying and selling stocks every 11-12 months is not a style I can follow. My style of investing is to accumulate undervalued stocks showing high overall scores. Moreover, I buy stocks with the mentality to hold them for the next 15-20 years.
FAQs
The magic formula uses two financial metrics to rank stocks. The first metric is called Earnings Yield = EBIT / Enterprise Value. The second metric is the Return on Capital Employed (ROCE) = EBIT / Employed Capital. The stock with the lowest combined rank becomes the most favorable for investing.
Suppose a stock earns a rank of 5 in terms of its earnings yield and 26 in terms of its ROCE. The combined rank of this stock will be 31 (=5+26). The stock with the lowest combined rank is the best. The top 20 stocks in terms of their combined ranks are considered good for investing.
It works because it helps us to invest in profitable businesses available at a comparatively good price. If we go into its details, the magic formula works because of two things. The first is the way it screens stocks based on earnings yield and returns on capital. The second is the unique methodology to buy and sell stocks. Read more about Magic Formula’s method of investing.
The stocks are ranked based on their earnings yield and Return on Capital (ROCE). Once all stocks in the list are ranked based on these two metrics, a combined rank of stocks is calculated by adding both ranks. The top 20 stocks with the lowest combined rank become preferable for investing.
It is certainly a big leap for those people who buy and sell stocks blindly upon others’ advice. The Magic Formula of investing has its roots in the principles of value investing. It asks people to buy stocks of profitable companies available at a reasonable price level.
I hope you liked the article. Please share your point of view in the comment section below.
Have a happy investing.