[Use Stock Screener] Undervalued stocks are shares that trade below their true value, offering a potential opportunity for investors. For example, if a stock is priced at Rs.80, but its intrinsic value is estimated to be Rs.100, it is considered undervalued by 20%. Identifying these stocks can lead to profitable investments, as buying them at a discount increases the likelihood of higher long-term gains. [For a broader perspective, check out our guide on Top Stocks to Buy in India.]
The concept of value investing revolves around purchasing stocks when they are undervalued, with the expectation that the market will eventually recognize their true worth. However, finding these stocks can be challenging, as popular companies often trade at inflated prices.
In this article, I’ll share with you methods on how to find undervalued stocks. We’ll focus on strategies that expert investors use to spot opportunities in lesser-known or out-of-favor stocks.
Undervalue Stock Screener
Updated: January 03, 2025 [Note: The table is scrollable]
Topics:
1. How to Use the Undervalued Stock Screener
The Undervalued Stock Screener provides access to a curated list of about 100 stocks from various sectors,. It can help you easily filter and identify stocks that are trading at low price multiples. This free tool lets you apply multiple filters to narrow down your stock search. It is based on financial metrics, such as price, market capitalization, P/E ratio, P/B ratio, and P/FCF ratio.
Example: Finding Small, Low P/E Stocks Below Rs.100. Let’s say you’re looking for smaller companies with a low P/E ratio, trading below Rs.100. Here’s how you can filter stocks using the screener:
- Price Range: Set the price filter to below Rs.100 (use <100) to focus on stocks whose unit price is smaller.
- Market Cap Range: Set the market capitalization filter to select smaller companies, for example, stocks with a market cap under Rs.5,000 crore (use <5000)
- P/E Ratio: Set a maximum P/E ratio, say 22, (use <22) to filter stocks that are trading at relatively low valuations.
By applying these filters, the screener will show you a list of stocks that meet these criteria. It is way for you to identify undervalued opportunities in smaller companies trading at low-P/E multiples. Moreover, you have also set the limit of Rs.100 for the price so that while investing, you need not pay too much to purchase each share.
After, you have identified potential stocks here, you can then further analyze these stocks using our Stock Engine app.
2. Undervaluation: The Concept
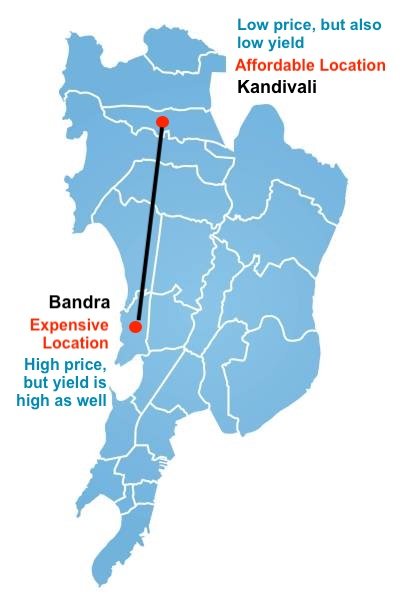
Suppose there are two 2-BHK flats in Mumbai. One is located in Kandivali and the other is located in Bandra. The distance between these two locations is about 20 Km.
You are an investor who is willing to buy a property in either of these two locations, but you have a condition. You’ll buy only a property whose rental yield is 3% or higher. So for you, a property whose yield is 3% or higher is undervalued. The concept sounds simple, right? But it highlights a very important element of “price valuation” of an asset. Let’s read further.
How rental yield is calculated? Annual rental income dividend by total cost of purchase. So if annual rental income is Rs.12,000 and cost of purchase is Rs.10,00,000, then rental yield will be 1.2% (=12,000 / 10,00,000).
People who know Mumbai will know the difference between a property in Bandra and in Kandivali. Properties in Bandra are very expensive. But for now, we are referring Bandra as “expensive” in price terms. In investment terms, valuation is not calculated in terms of price, it calculated by comparing earnings with price.
To correctly estimate the value of a property in Bandra and Kandivali, I’ve collected some data. Check it in the below table.
| Area | Value (Rs.Cr.) | Carprt Area | Flat Type | Rent | Rental Yield |
|---|---|---|---|---|---|
| Bandra West | 5.25 | 850 sqft | 2 BHK | 1,35,000 | 3.09% |
| Kandivali West | 2.23 | 950 sqft | 2 BHK | 48,000 | 2.58% |
Comparing Bandra and Kandivali, Bandra is looking better valued. Why? Because its rental yield is higher. No matter, the buyer will have to pay more than double the price to buy the property in Bandra as compared to Kandivali, but in terms of ROI – return on investment, Bandra looks comparatively undervalued.
Takeaway: Had we valued the property only in terms of price, Bandra property would have always sounded overvalued. But in earning terms, it looks better valued than Kandivali. Similarly, in stock investing, price valuation cannot be accurately done without knowing the potential future earnings of the asset.
3. The Challenge of Stock Investing
The challenging part of stock investing is the estimation of future earning potential of the company.
In the above example, it was easy to forecast the future rental yield of the properties. Hence, it is easier to value a real estate property.
But in stock investing, companies are involved. A company is a complicated asset where variables like man-power, machinery, land, building, raw-material, customers, market demand, local and global economy, etc factors can effect the earning potential of a company.
The easy with which we can estimate the future rental yield of a property in Bandra, we cannot estimate the future earnings (net profit) of a company.
An investor like Warren Buffett has the knowledge and resource to estimate future earnings more accurately than us. This is the reason why he is such a successful investor.
Let’s understand it using an example
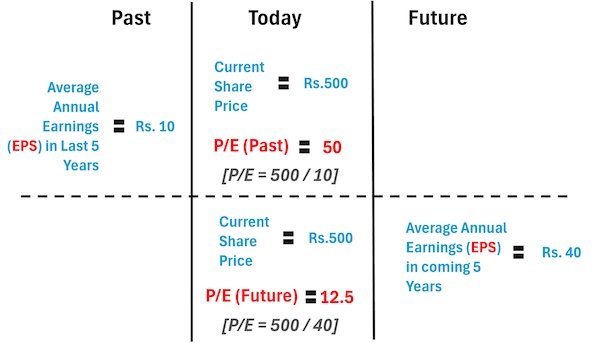
Suppose there is a new age company called “ABC Ltd.” (an IPO like Zomato, Swiggy, Zaggle, etc).
- Past Data: In the last five years of its operation, the company’s EPS was Rs.10 per share. Currently, the share price of the company is say Rs.500 per share. So, at this EPS of ABC Ltd., the Price-To-Earnings (P/E) ratio is 50. It looks very expensive, right?
Now, suppose the ABC Ltd. has been investing to expand and modernize its operations. It has been estimated that, in the coming 5 years, its EPS will grow from Rs.10 to Rs.40 per share.
- Future Data: In the next five years of its operation, the company’s EPS will become Rs.40 per share. At the current share price of Rs.500 per share. the future P/E ratio is 12.5. Even by the definition of Benjamin Graham, the P/E of 12.5 makes this stock undervalued, right?
I’ve used this example to highlight that how our ability to estimate future earnings of a company makes the task of price valuation of stocks look so accurate. But there is fallacy and this is what makes stock investing so challenging for everybody (even Warren Buffett). What is the fallacy?
How in the world can me and you will know for sure that in the next 5 years, ABC Ltd’s EPS will grow to Rs.40 levels? We’ll never know it, right? So this is where we start to make assumptions about future earnings and the inaccuracy starts to creeps in.
4. What is the Objective of Finding Undervalued Stocks?
The primary objective of finding undervalued stocks is to achieve superior long-term investment returns.
Undervalued stocks offer the potential for significant price appreciation as the market eventually recognizes their true intrinsic value.
By identifying and investing in these opportunities, investors can benefit from both capital gains and dividends. A good undervalued stock can create a dual source of income that enhances overall portfolio performance.
The aim is to buy quality stocks at a discount, reducing investment risk and increasing potential returns over time.
Margin of Safety
Another key goal is to build a margin of safety in investments.
The margin of safety is the gap between the stock’s current price and its intrinsic value. It serves as a cushion against possible minor errors that can always creep-in while estimating the intrinsic value. Margin of safety can also work as another safety net against market volatility.
We’ve already discussed that price valuation’s accuracy is dependent on how close to reality are our future earning estimates. There is a high chance that in the process of stock analysis, we overestimate the future earnings of a company. In such a case, our assumed future performance will not be met. Hence, a lower entry price helps mitigate losses.
This conservative approach is especially valuable in stock investing.
These days, I see young men and women with only limited experience of stock market cycles talk so optimistically about the stock market. In a way it is good because it brings lot of people to the market. But entering the market with “excessive optimism” is dangerous.
For such people, it is essential to learn to conservative. In fact, over-enthusiasm in stock market can cause more losses.
Finding undervalued stocks allows investors to stay focused on long-term wealth creation. It is a way to avoid impulsive decisions driven by short-term price movements.
With this as our premise, allow me to share with you a method to find undervalued stocks.
5. How To Find Undervalued Stocks
Looking for undervalued stocks when the market is at its peak may become a futile exercise. I’ve personally wasted hours doing it. It is true that there are always value stocks hidden in any type of market. But finding them is easier when the market is not at its peak. With this premise, allow me to show you two steps of how to find undervalued stocks:
Step A. Analyze the Index
Before we go ahead and start analyzing individual stocks for price valuation, let’s analyze the index first. This will be done in the following three sub-steps:
Step #A1 – Index Watch
In this step, we must watch the movements of the two big indices, the Nifty50, and Sensex. While we are observing the index, we are actually waiting for the index to correct or crash. How this is useful?
- Bull Market: In such a market, main indices like Sensex and Nifty are only going up. When indices are rising, fundamentally strong stocks tend to become more overvalued.
- Bear Market: In such a market, the main indices fall (called correction or even crash). When indices are falling, even fundamentally strong stocks tend to shed their price, hence they get undervalued. Read more on the bear market.
In the pursuit to find undervalued stocks, the task becomes comparatively easier during periods of corrections or a crash. But it is not sufficient to watch index movements alone. We have to do more. Read step #A2.
Step #A2 – Look Deeper Into The Index
Look slightly deeper into the index’s PE & PB ratios. Sensex’s PE & PB ratio can be found by visiting BSE & NSE’s website. Let’s see how Sensex’s P/E & P/B have changed in the last 12 months:
| Name | Points | Year | P/E | P/B | Div.Y (%) |
| Sensex | 59,842 | 16-Aug-22 | 23.26 | 3.43 | 1.19 |
| Sensex | 55,583 | 16-Aug-21 | 30.27 | 3.55 | 0.97 |
| Nifty 50 | 17,825 | 16-Aug-22 | 21.34 | 4.18 | 1.34 |
| Nifty 50 | 16,563 | 16-Aug-21 | 25.62 | 4.31 | 1.10 |
It is interesting to observe the index in terms of its PE, and PB ratios. I maintain a historical PE and PB database of Sensex. This gives me a more accurate perspective on the present valuation of the overall stock market.
Following observation from the above table
- Points Movement: Sensex jumped from 55,583 to 59,670 (up by 7.66%) between Aug’21 and Aug’22. In the same period, Nifty50 jumped from 16,563 to 17,825 points (up by 7.62%). Looking at this movement, we can assume that the market is following an overvaluation trend.
- P/E Movement: Sensex PE fell from 30.27 to 23.26 (fall by -23.16%) levels between Aug’21 and Aug’22. In the same period, Nifty50 PE fell from 25.62 to 21.34 levels (fall by -16.71%). Though the indices have moved up, their PE is falling. It points toward the market becoming undervalued.
- P/B Movement: Sensex PB fell from 3.55 to 3.43 (fall by -3.38%) levels between Aug’21 and Aug’22. In the same period, Nifty50 PB fell from 4.31 to 4.18 levels (fall by -3.02%). Falling PB is again hinting towards a trend leading to undervaluation.
- The dividend Yield (DY): Sensex’s DY jumped from 0.97% to 1.19% (up by 22.68%) between Aug’21 and Aug’22. In the same period, Nifty50’s DY jumped from 1.1% to 1.34% (up by 21.82%). Increasing dividend yield is also pointing towards undervaluation.
Between Aug’21 and Aug’22, the indices have moved up by about 7.5%. But the P/E, P/B, and Dividend Yield (DY) numbers are hinting toward undervaluation.
Step #A3 – PE Trend Analysis of The Index
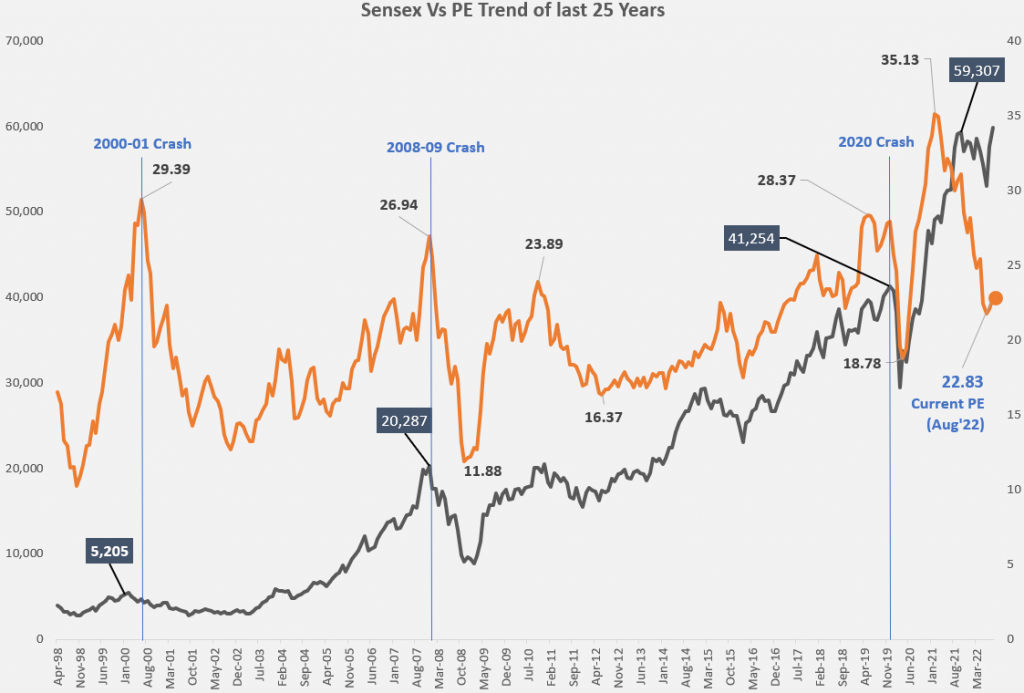
PE trend of the index can give an even clearer perspective about the market valuation.
In the years 2000-01 & 2008-09, 2020, etc stock market worldwide saw their worst crisis. During these moments of turmoil, the average PE ratio of the stock market peaked and then bottomed.
The Sensex levels and its P/E ratios in the last 25 years are shown in the above chart.
Studying this chart gives an idea about the Index’s behavior. We are trying to figure out a maximum level of PE at which the index corrects or crashes. Why does it correct? Because it has become overvalued. Here are three quick examples that will further clarify the point:
Three Examples
- 2000-01 Dot Com Crash: Sensex peaked by Dec’2000 before crashing. During those moments, Sensex was trading at 5,200 levels and its P/E ratio was 29.39. At these levels of P/E, the index crashed as the investors started booking profits. Beyond this point (PE29), the trend of undervaluation starts.
- 2008-09 Mortgage Crisis: Sensex peaked by Dec’2007 before crashing. At that time it was at 20,000 levels. The P/E ratio of the Sensex was 26.94. So this time, the market crashed even before it reached 2000-01 levels of PE29. Nevertheless, we can view even PE27 as a level indicating overvaluation.
- 2020 Covid Crisis: Sensex peaked by Mar’2020 before crashing. At that time it was at 41,000 levels. The P/E ratio of the Sensex was 28.37. So this time, the market crashed getting very close to the 2000-01 levels. This is another takeaway that a PE29 for Sensex is a level to note. Once the index will reach this level, it will either crash or at least correct itself.
- 2022 Current Levels: The P/E ratio of Sensex is at 22.83 as of today (August 2022). It is far below the danger mark of PE27 or PE29. Hence we can say that today at PE23 levels, there are more chances of finding undervalued stocks than at PE27 to PE29 levels.
Takeaway: When the index is undervalued, there are more chances of finding undervalued stocks in the market. Searching for value stocks when index is at its peak (overvalued) may be a futile strategy. How to judge if the market is undervalued or not? We can study the PE of the index (Sensex or Nifty) as shown in the above three steps. As a rule of thumb, when the index’s PE is around 29, the market is undervalued.
Step B. Analyze Individual Stocks
There are about 5000 number stocks in the market. Which stocks to analyze for undervaluation when the index is falling? Principally, we must target only the stock of fundamentally strong companies. But it requires a lot of digging into their financial statements. It is a skill that must be learned and is also time-consuming.
If one does not want to go into so much detail work, one can target to buy blue chip stocks when the index is falling. Alternatively, they can also practice index investing during corrections and a crash. But it is also true that, as this approach is easy, everyone practices it. Hence, its potential returns are smaller.
This is where a tool like ours, Stock Analysis Engine (SAEngine) becomes useful. It has a pre-coded theme that screens undervalued stocks. The screener’s algorithm works by churning the following numbers from the financial reports of companies:
4-Parameters
- Intrinsic Value: Our ‘SAEngine’ is coded to calculate the intrinsic value of the top 850 number stocks in the Indian stock market. Any of these stocks whose current price is below their intrinsic value is tagged as undervalued. Suggested Reading: Net Present Value Calculation.
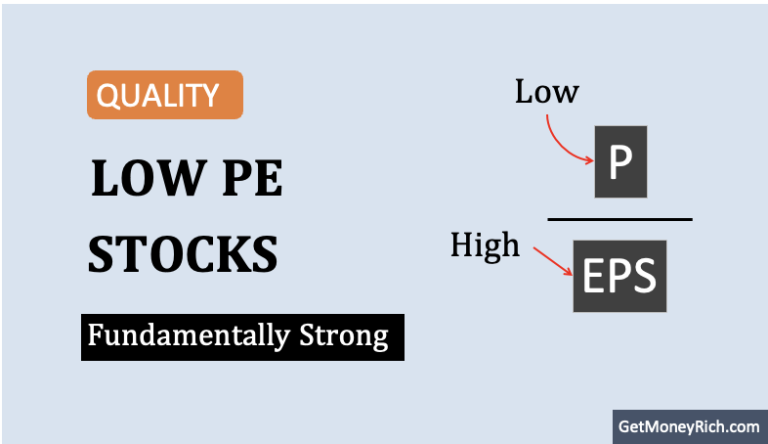
- Low PE: Our algorithm loves low PE stocks. As a general rule of thumb, stocks whose PE is 20 or lower is preferred. But there are some growth stocks whose PE is higher. For such stocks, another metric is used for the evaluation (PEG). Suggested Reading: Price to Earning Ratio – Basics.
- Low PEG: It is basically an advanced version of the PE ratio. Here the company’s EPS growth factor is also used to judge if the company is overvalued. Here, our algorithm considers EPS growth rates of periods, 3-Year, 5-Year, and 10-Year. Suggested Reading: PEG Ratio – Basics.
- Low EV/EBITDA: It is a ratio that closely resembles the PE ratio. But it renders a slightly more accurate valuation than PE. Why? Because it also considers the company’s debt and cash position to judge the company’s market valuation. Suggested Reading: EV to EBITDA multiple – Basics.
Conclusion
Investing in undervalued stocks has two benefits. First, it greatly reduces the risk of loss when the market becomes volatile. Second, in a long term, the chances to earn above-average returns get amplified (related reading).
So, in this article, we have seen how to find undervalued stocks. But I would also like to touch base on another important factor that affects the price valuation of stocks. It is inflation.
Effect of Inflation on Price Valuation
In countries like India, we cannot avoid looking into inflation numbers. PE ratio, and hence price valuation, is affected by inflation rates. How?
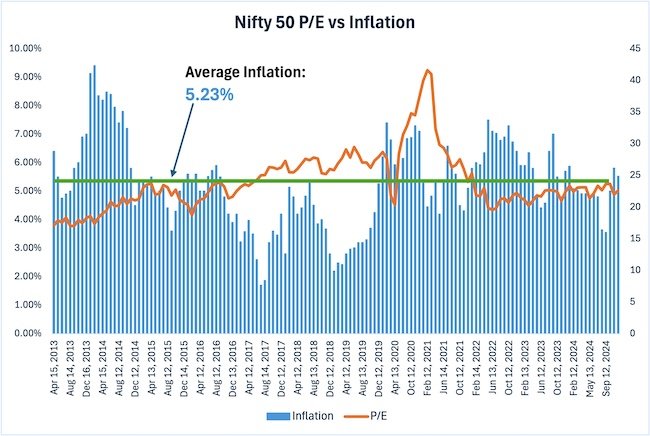
The above data set, shows a moderate negative relationship between inflation and the P/E ratio of the Nifty 50.
This means that when inflation rises, the P/E ratio tends to fall, and when inflation drops, the P/E ratio often increases.
- A possible reason for this is that higher inflation increases costs for businesses, reducing their profit margins. This can make investors less willing to pay a higher price for the same earnings, lowering the P/E ratio.
- Conversely, lower inflation helps businesses control costs, which can boost profits and make investors more willing to pay higher prices, leading to a higher P/E ratio.
However, this relationship is not perfect.
Other factors, like economic growth, company performance, and investor sentiment, also influence the P/E ratio. For example, during times of economic optimism, investors may be willing to pay higher P/E ratios even if inflation is high. Similarly, during economic uncertainty, the P/E ratio might remain low even with lower inflation.
This highlights that while inflation can influence the P/E ratio, it’s just one of many factors affecting stock market valuations.
If you found this article useful, please share it with fellow investors or leave your thoughts in the comments below!
Have a happy investing.


Your article was a breath of fresh air in a sea of financial advice. The way you presented the rules was not only informative but also incredibly relatable. You managed to distill complex financial concepts into practical and easily understandable guidelines. Your writing style is engaging and approachable, making it a joy to read and absorb the valuable insights you shared.
Amazing Mani You are really doing well.
Great analysis sir, good to see PNCINFRA in the list!
Dear Mani,
i am thankful to you very Much . your Blogs are really great and informative. they will create the interest in each on of us to take the journey in the Stock market with positive mindset ( without Much fear ) . most of your ideas and short listed companies are really doing well and gave good returns.
Thanks,
Manjunath
What’s your take on CANSLIM model? You should add these stocks in your website. I think it gives a complete view of a health of stock.
What are your thoughts on First Source Solutions, Tyche Industries & Lincoln Pharmaceuticals?
Dear Mani,
You said that PE below 15 is undervalued but at some places you are recommending stocks with PE of 75 plus e.g. Nestle. I am little confused being a truly non l person. Can you please help.
P/E is the first indicator of undervaluation. The real measure of undervaluation is “intrinsic value”.
What I publish as a list are not recommendations. They are just my scheme of things shared with my readers.
Thank you very much
Can you please mention dates to your article. Previous most comment is 26.04.2019. Last price updated is 18.09.2020. This will mislead many of the readers
Very Nice explanation. Keep it up.
Hi Sir . Would it be possible to comment about KEI Industries Limited Share . Thanks
We can make the portfolio of high dividend stocks, blue chip, growth shares, high PE shares from high contributing sectors.
Good idea
I must say your blog is excellent for layman’s understanding. Salute to your dedication for sharing knowledge in extremely easily understandable write up.
Refer Karan says:
25-03-2020 AT 11:48 AM
According to your table, all the stocks are undervalued.
NALCO
Rishabh Digha Steel
Hind. Zinc
Energy Dev. Co.
REC.
Aren’t all undervalued when CP of all of them is lower than their respective FP… ?
REPLY
Mani says:
25-03-2020 AT 11:55 AM
These stocks had enterprise value less than its market capitalisation.
I don’t understand your reply. I understand that from your table Karan’s question is correct. I need to know how RDS & HZ overvalued?
Dear Mani Sir, In your article it says if inflation is showing a downtrend, future growth may not be as great. As per my understanding, if there is downtrend in inflation, then P/E will also be reducing for the index, low p/e hints towards undervaluation, low inflation means there will be spending from the public, so how future growth may not be great ?
Generally I use your worksheet to check fundamentals and valuation, but this question I asked for my understanding, my analysis might be wrong as I am still at the learning stage.
Thank you for your time
I’ve quoted it based on the data. Please check the justification provided in the article itself.
Thanks for sharing your valuable analysis knowledge and helping us to learn.
1st time I see such kind of simple explanation for a very complicated thing. Thanku
Why there isn’t pharma companies in above undervalued company list except natco pharma. Are they really overvalued?
Due to their negative past performance. Future is good post COVID
I am new to stock investing and find your blog very easy to understand and follow with a wealth of information. Just a query though – is there a starting point for beginners like me , as in a guide to go through the articles in some order for better understanding? Right now am reading your articles in random order
Thanks for a deep query.
All learning must always start with a requirement like why we must manage money, why to invest, etc. Hence, I’ll suggest you to start with this article, and then follow the links. I think it should work this way.
Sir,
I have started using your Stock Analysis Worksheet recently. It is very useful and user friendly.
I find one difficulty of getting fig of “Shares in Issue” from Moneycontrol site. They are publishing only fig in %. From where to get that fig.
Time being I am using BSE site for that fig. But it mentions “No of fully paid equity shares held” and ‘Total No. of shares held” (which includes No of shares underlying Depository Receipts). Which value shall I use from above?
Please guide.
Please refer the FAQ’s in the product page. The solution is provided there. Thanks.
Sir, am keep investing in stock market since 3 years. I have gone through many blogs but this is one of the platform where beginners can easily understand with ur common english. I like ur analysis and views on each topic brought here. Its helpful.
Can u keep a separate tab in ur blog and provide ur continuous view on trending stocks so it will help to pick a right stock at right
Thanks for your feedback.
According to your table, all the stocks are undervalued.
NALCO
Rishabh Digha Steel
Hind. Zinc
Energy Dev. Co.
REC.
Aren’t all undervalued when CP of all of them is lower than their respective FP… ?
These stocks had enterprise value less than its market capitalisation.
amazing collection sir thank you
Thanks
Dear Mani Ashirvaad from a senior citizen, for depth study through superb calculation.
Thank you sir for your blessings.
Thanks for sharing the post. The way you narrated the post is good and understanding. After reading this post I learned some new things. Keep posting. Please let me know for the upcoming posts.
Hello! I just came accross your website and I must say it is one of the BEST blogs I have come accross. The way you explain things, the way you share your knowledge and findings, the way you explain in simple lay man language, your graphs and infographics – everythings shows how much passion you have for this subject and to share this knowledge so generously with others. What I like the best about you is that you don’t give recommendation to buy A or B stock. You give us tools to analyze and make our own decison. Thank you so much for this wealth of information on analyzing stocks that I didn’t find in a single place on the web. Wishing you all the best for your future.
It is the feedback like this that keep me going. Thank you.
Have you heard of the new URBT stock that is rising? With the shares that I have purchased I made some money off URBT but I would like others to look in to it as well.
Such a beautiful piece of information ever I have seen in a blog.
Thanks
very useful article
The insights you give here are PURE GOLD.
Outstanding.
I like your valuable a d genuine recommendation. 2 years back in 2017 you have recommended SYNGENE INTERNATIONAL, TODAY THEY DECLARE BONUS SHARE
Thanks, but I do not really recommend shares. I just share my analysis. But it’s good that it helped. Thanks a lot for giving your feedback. Readers like you keeps me going. Ciao