
Venky’s is a stock which operates in FMCG sector. It’s line of business is Food Processing. People know Venky’s more for their line of product dealing with ‘processed chicken’. It is one of the most well known businesses operating in the small cap sector.
Why Venkys stock?
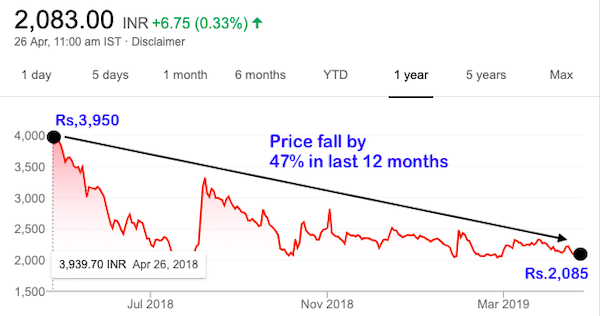
In last 12 months, the price of Venkys stocks has fallen by more than 47%. It is one of those stocks which has given stellar returns in the past. Check the below table.
| Name | Return (1Y) | Return (3Y) | Return (5Y) | Return (10Y) |
| Venkys Ltd | -47.1% | 74.08% | 43.64% | 43.19% |
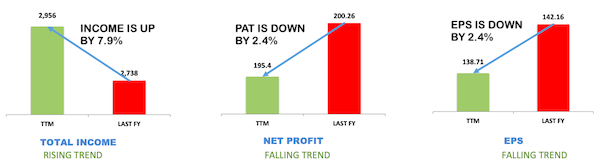
Probably the price fall is caused by the weak fundamentals of Venkys. Hence I decided to look into their TTM (Trailing Twelve Month) data. What I could find was this:
Report generated on my stock analysis worksheet.
The fundamentals of Venkys has only marginally gown down as per TTM data. PAT & EPS is down by 2.4% only. I am sure this small weakness cannot cause a price correction of more than -47%.
This is also true that in Sep’18 quarter (July’18 & Sep’18), Venkys performance was terrible. In this period its EPS was just at Rs.3.89 against an expected average of Rs.40 per share. But in Dec’18 quarter (Oct’18 & Dec’18) its EPS bounced back to Rs.48 per share. Mar’19 quarter is expected to be equally good.
What does it mean? It means, there are high chances that Venkys share price today might be trading at undervalued price levels.
Intrinsic Value of Venkys Stocks
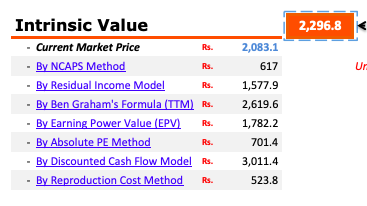
There was a doubt that whether Venkys stocks are really undervalued or not. Hence I decided to use ‘my stock analysis worksheet‘ for Venkys. Idea was to check how undervalued or overvalued is this stock.
The result did not disappoint me…
Report generated on my stock analysis worksheet.
Current price of Venkys was Rs.2,083 and my worksheet was estimating its intrinsic value as Rs.2,296. In terms of discounted cash flow model (DCF model) the intrinsic value was as high as Rs.3,011.
Now I was becoming more confident about Venkys. But I wanted to check more.
Profitability Margins
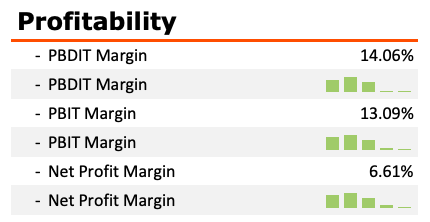
Those companies whose profitability margins are high, attract me more. I never consider a stock without looking at their profit margins.
Report generated on my stock analysis worksheet.
Having said that, I was also aware that Venkys being in the food processing line of business, its margins will not be too high.
Hence while dealing with such stocks, I always compare the margins of my stock with that of its competitors. It gives me a sense of confidence. Let’s see how Venky’s pans out as compared to its competitors:
| Description | Market Cap (Rs.Cr.) | Revenue (Rs.Cr.) | PAT (Rs.Cr.) | PAT Margin (%) |
| Venky’s (India) | 2,929.81 | 2,955.98 | 195.4 | 6.55 |
| Prataap Snacks | 2,216.08 | 1,143.32 | 39.8 | 3.44 |
| Tasty Bite Eatables | 2,237.55 | 338.66 | 29.8 | 8.51 |
Though the best PAT Margin among the 3 competitors is enjoyed by ‘Tasty Bite’, but it is a much smaller company compared to Venkys. Both in terms of Revenue and PAT, Venkys is far bigger. Considering the size of Venky, I think PAT Margin of 6.55% is decent.
Shareholders value
There are many ways in which a company can enhance the shareholders value. Few ways which I think is most easily recognisable are the following:
- Market price growth: We have already seen how fast the market price of Venkys has grown in last years. In Last 10 years its price growth has been from Rs.57 per share to Rs.2083 per share. This is a growth of 43% p.a. in 10 years (also see return table shown above).
- Dividend payout & its yield: Venkys being a small cap growth stock, I was not expecting it to pay dividends. But I was pleasantly surprised to see that it has paid dividend in all years since last 10 years. Moreover in terms of growth, dividend per share paid by Venkys has grown from Rs.3.5 per share to Rs.8 per share in 10 years. This is a decent growth rate of 8.6% p.a. But this is also true that at current price levels, dividend yield of Venkys is less than 0.4%.
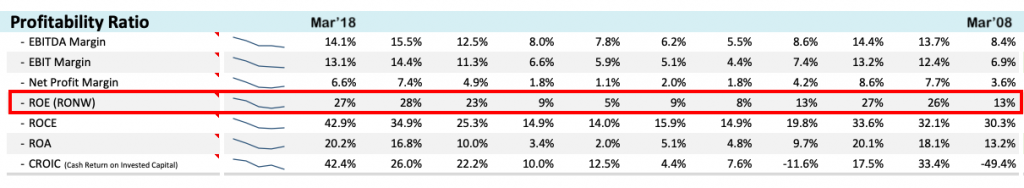
- Return on Equity (ROE): This is one of my favourite metric using which I judge if the stocks has enhanced shareholders value or not. How I do it? I see the ROE trend in last 10 years. If ROE is showing a growing trend, it is a very good hint that the stock is being run by competent managers.
ROE Trend of venkys in last 10 years is shown below:
Report generated on my stock analysis worksheet.
Overall Performance
In terms of overall performance, my stock analysis worksheet considers several parameters to grade a stock. Frankly speaking, intrinsic value estimation should be more than enough, no further checks are necessary.
But I personally find comfort in aggregating all the numbers in one place to finally grade a stock as per its overall performance. My worksheet does it nicely for me.
Let’s see how Venkys shares fares in its overall analysis:

Report generated on my stock analysis worksheet.
For my worksheet, a good score is 85% plus. But Venkys has scored a rating of 80-81%. What does it mean? It means, there is a bit of apprehension.
Where Venkys has scored high?
- Low Price (100%).
- Future Growth Prospects (100%).
- No Bankruptcy Threat (100%).
Where it has underperformed?
- Management’s Efficiency (80% – Not bad).
- Profitability (32% – inherently low).
- Financial Health (72% – cause of concern).
I will say that it is only the profitability and Financial Health which is looking worrisome. So how to deal with it? Further price correction by 6-7% may take care of the negativity of low profitability and weaker financials.
Conclusion
Its better to wait for further price correction (6-7%). But if one cannot wait, I personally think that the present price levels are also not so bad. At the moment when I am publishing this post, the market price of Venkys is already Rs.1,978 per share.
Venkys is a small cap stock. Its future growth prospects may not be as great as is past 10 years. But even if it can replicate 50% of it – I still like it.
My stock analysis worksheet has almost given a thumbs-up to me for Venkys, but knowing myself – I will add it to my watch list and wait for a better price levels.

![How To Build A Winning Stock Portfolio [India]](https://ourwealthinsights.com/wp-content/uploads/2010/06/Stock-Portfolio-Image.png)


What should we do with Venky .as today on 24/3/20 rate is 620.
gone through, found useful, want to boost my confidence in your method, thank you. loking forward to know the real benifit.
hi mani…can you suggest few stocks usingthe worksheet will pay the fees .
thanks
prakash